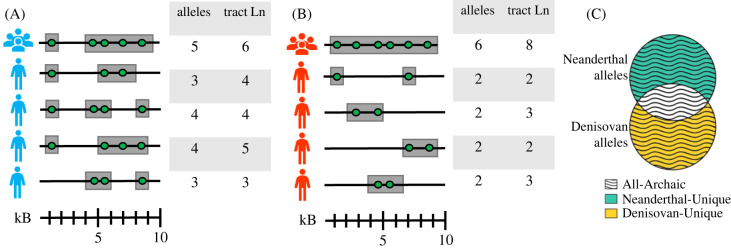
Figure 1.
An illustration of population- and individual-level archaic ancestry coverage. Here, we show the archaic alleles (green circles) and archaic ancestry tracts (grey bars) present in a genomic region (the black line) for two populations, (A) and (B). Each population contains four individuals, and their ancestry coverage is shown next to each individual along with the total number of SNPs with archaic alleles they have as well as the archaic ancestry tract length. For the population-level coverage, each archaic allele or genome region that is found in any individual in the population counts towards the total, so population-level coverage is the sum of SNPs with archaic alleles or ancestry tracts found across all individuals in that population (the top line in A and B). (C) Illustrates the terms ‘Neanderthal-Unique’, ‘Denisovan-Unique’ and ‘All-Archaic’ as used in this paper, based on whether they are found in Neanderthals, Denisovans, or both.

