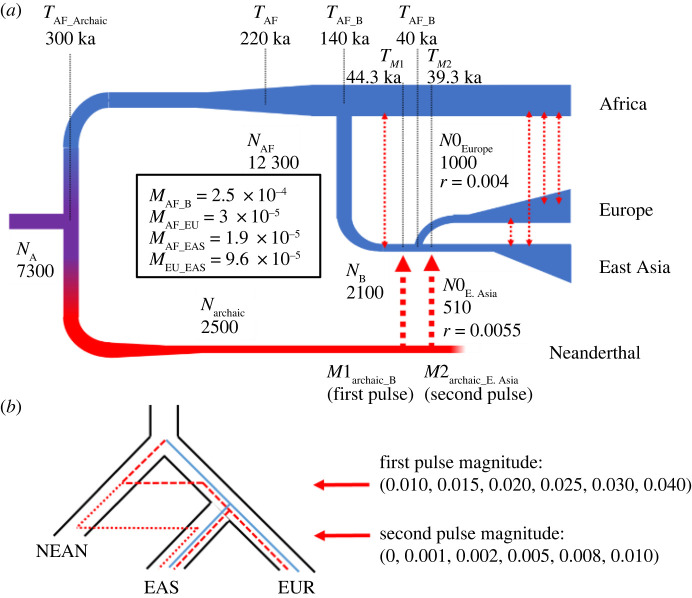
Figure 3.
The demographic model used in our simulations and the comparison of archaic ancestry coverage in East Asians (EAS) and Europeans (EUR) between simulated and empirical data. Two pulses of introgression are depicted in this figure, but some simulations only assumed one pulse into the ancestral population of Europeans and East Asians. (a) A summary of the model, including population sizes and the timing of population splits and occurrences of gene flow. (b) An illustration of the two pulses of gene flow, with the values used for each of the demographic simulations.

