Figure 3.
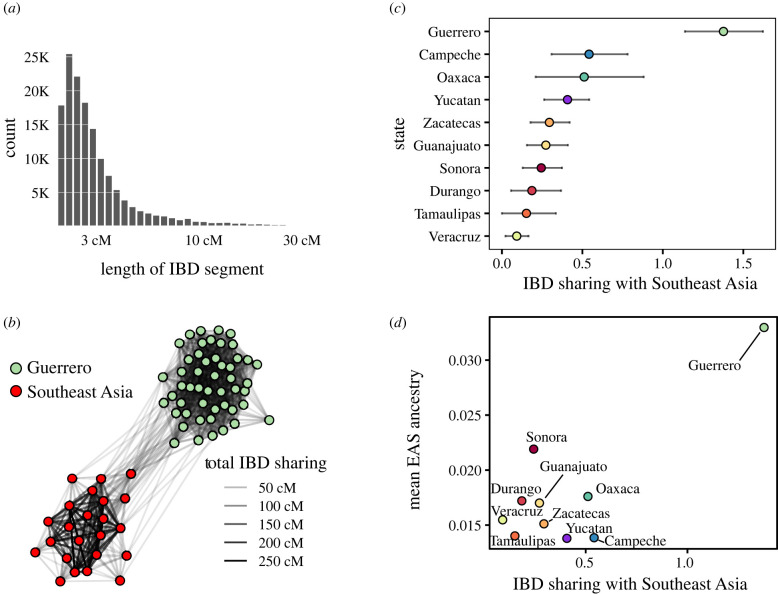
IBD sharing between Southeast Asia and Mexico. (a) Length distribution of IBD fragments detected with hap-IBD in the merged data set (Mexican admixed samples and continental reference panels). (b) Sub-graph of total IBD sharing in Guerrero and Southeast Asian samples (populations included are those from maritime Southeast Asia detailed in table 1, Arrays C and D). Total IBD sharing is computed by summing the length of IBD segments shared between each pair of individuals. (c) Normalized (per individual pair) total IBD sharing of Mexican states with Southeast Asia. The error bars denote the quantiles 0.05 and 0.95 of the bootstrap distribution. To generate the bootstrap distribution, we sample with replacement N samples, where N is the number of samples in each state, then we compute the mean sum of IBD segments shared per pair of individuals. We repeat this process one thousand times to compute the distribution quantiles. (d) Average genome-wide East Asian ancestry versus IBD sharing with Southeast populations for each Mexican state. Guerrero is clearly an outlier, exhibiting both the highest East Asian ancestry cluster membership according to ADMIXTURE, as well as the highest IBD sharing with Southeast Asia (see electronic supplementary material, figure S4 for further details).

