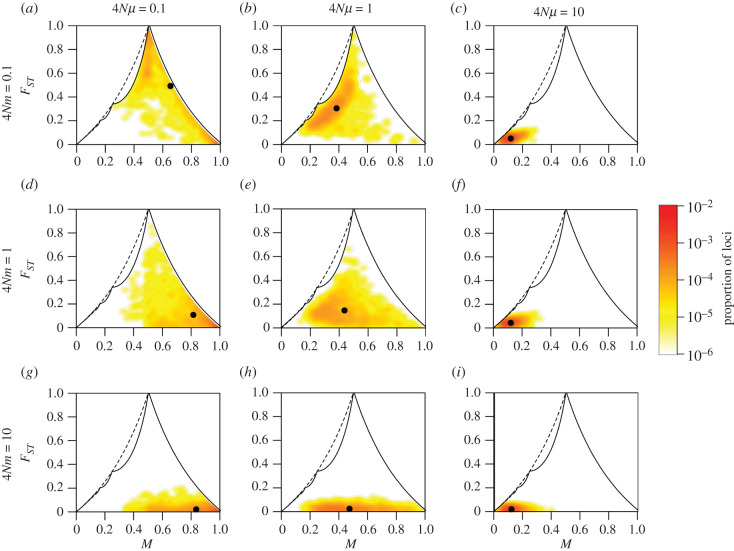
Figure 2.
Joint density of the frequency M of the most frequent allele and FST in the island migration model with K = 2 subpopulations, for different scaled migration rates 4Nm and mutation rates 4Nμ. (a) 4Nμ = 0.1, 4Nm = 0.1. (b) 4Nμ = 1, 4Nm = 0.1. (c) 4Nμ = 10, 4Nm = 0.1. (d) 4Nμ = 0.1, 4Nm = 1. (e) 4Nμ = 1, 4Nm = 1. (f) 4Nμ = 10, 4Nm = 1. (g) 4Nμ = 0.1, 4Nm = 10. (h) 4Nμ = 1, 4Nm = 10. (i) 4Nμ = 10, 4Nm = 10. The black solid line represents the upper bound on FST in terms of M (equation 3.1); the black point plots the mean values of M and FST. Colours represent the density of loci, estimated using a Gaussian kernel density estimate with a bandwidth of 0.02, with density set to 0 outside of the bounds. Loci are simulated using coalescent software MS, assuming an island model of migration and an infinitely-many-alleles mutation model. Each panel considers 1000 replicate simulations, with 100 lineages sampled per subpopulation. Electronic supplementary material, figures S1 and S2 present similar results for K = 6 and K = 40 subpopulations, respectively.

