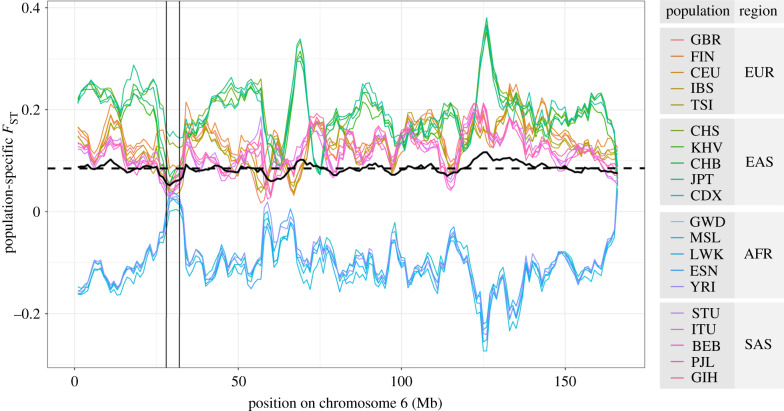
Figure 2.
Population-specific FST across chromosome 6, in overlapping windows of 5 Mb, with a step-size of 1 Mb. The FST values were estimated for each population relative to all other populations available (i.e. each population relative to the entire world, with no geographic grouping used). Each coloured line represents a specific population; the black line represents the overall FST for each window; the black dashed line is the average overall FST for the entire chromosome. The vertical lines delimit the MHC region, within which HLA genes are contained. See electronic supplementary material, table S1, for 1000 Genomes abbreviations of population and region names.

