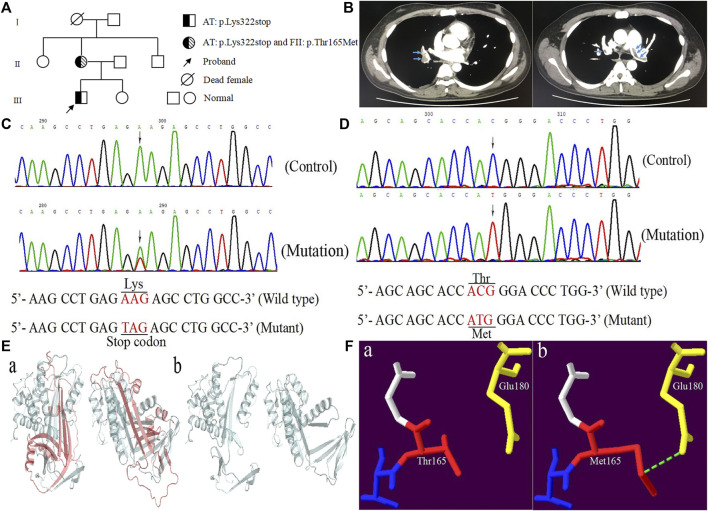
FIGURE 1.
The clinical and genetic data of the proband. (A) Pedigree chart of the family. (B) The computed tomography angiography of the proband. (C) Sequence diagrams of SERPINC1:p.Lys322stop. (D) Sequence diagrams of F2:p.Thr165Met. (E, F) Model analysis diagrams: (A, B) AT:p.Lys322stop and (A, B) FII:p.Thr165Met before and after mutations.

