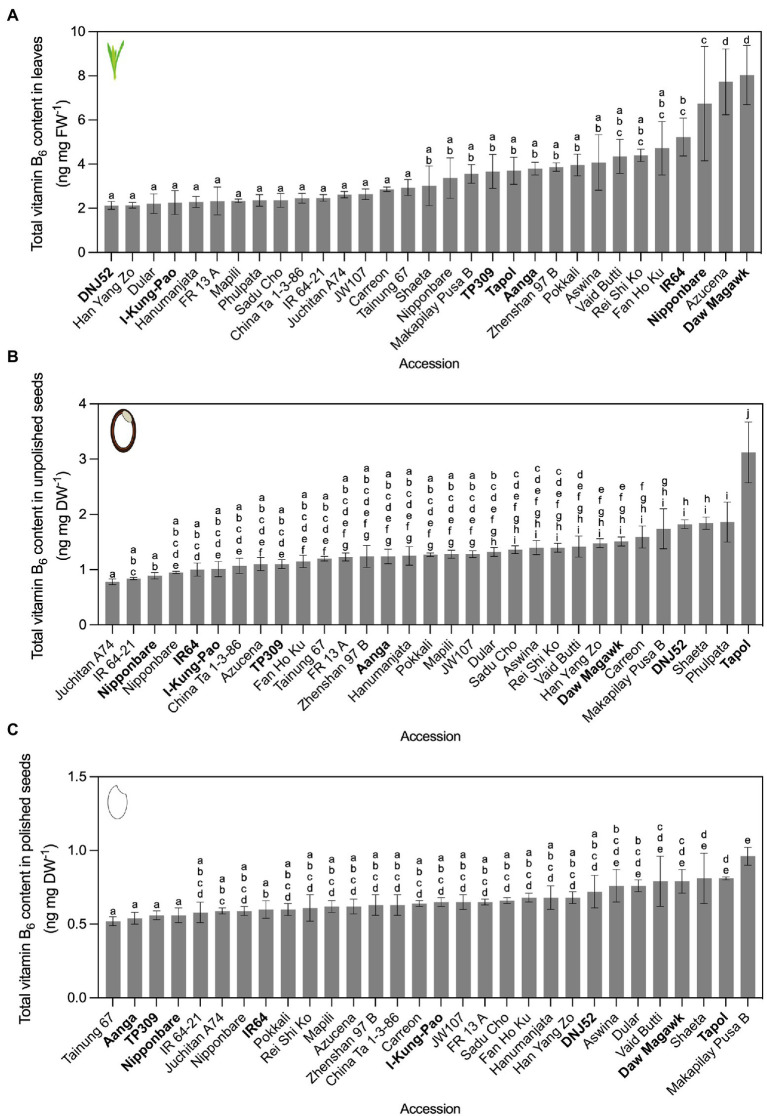
Figure 3.
Vitamin B6 contents quantified by yeast assay. Leaves (A), unpolished seeds (B), and polished seeds (C) in contrasting rice accessions grown under greenhouse conditions and quantified by yeast assay. Twenty-one accessions cultivated in experiment 1 were re-sown, alongside 10 additional accessions from the Oryza SNP Project (experiment 2). The accessions with vitamin B6 content below the 25th percentile of the distribution were considered as low vitamin B6 accessions and those with vitamin content above the 75th percentile were considered as high vitamin B6 accessions. Low, intermediate, and high vitamin B6 accessions selected for HPLC analysis are bolded. Mean ± SD of 3 biological replicates, except Nipponbare (n = 6), IR64 (n = 6), and TP309 (n = 6) for the three tissues; IR 64–21 (n = 2) for leaves; Nipponbare (n = 2) and IR 64–21 (n = 2) for unpolished seeds; and Nipponbare (n = 2), IR 64–21 (n = 2) and Phulpata (n = 0) in polished seeds. The effect of accession on total vitamin B6 contents in panels (A–C) was determined by one-way ANOVA (α = 0.05) with multiple comparisons and Tukey’s post-hoc test. Statistically significant differences between accessions are denoted by different letters.

