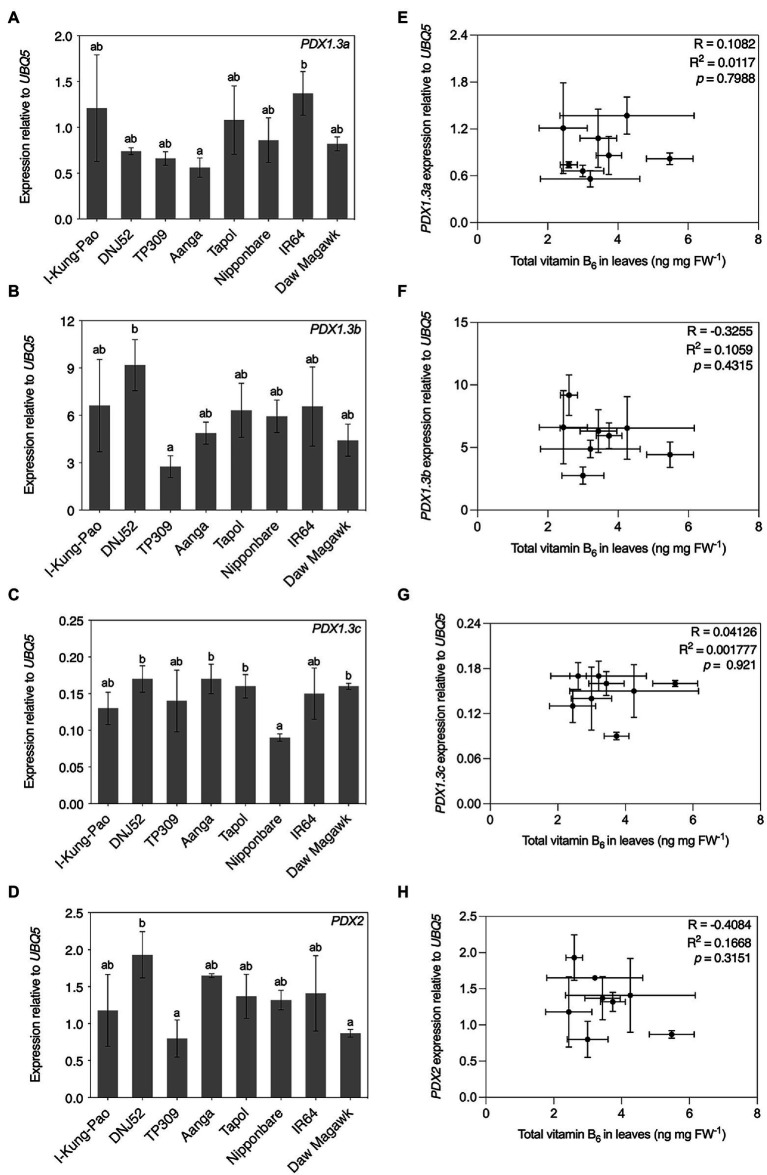
Figure 7.
Expression and correlation of select genes for vitamin B6 biosynthesis de novo enzymes in leaves of accessions with contrasting vitamin B6 contents. RNA was isolated from plant material used in Figure 5B for qRT-PCR assays of PDX1.3a (A), PDX1.3b (B), PDX1.3c (C), and PDX2 (D) expression. Expression was normalized to UBQ5 and data are the mean ± standard deviation of n = 3 biological replicates. Accessions are ordered according to leaf total vitamin B6 content as determined in Figure 5B. The effect of accession on gene expression was determined by one-way ANOVA (α = 0.05) with multiple comparisons and Tukey’s post-hoc test. Statistically significant differences between accessions are denoted by different letters. Correlation of PDX1.3a (E), PDX1.3b (F), PDX1.3c (G), and PDX2 (H) gene expression from panels (A–D), respectively, with leaf total vitamin B6 contents in Figure 3B by Pearson’s correlation coefficient test (p < 0.05).

