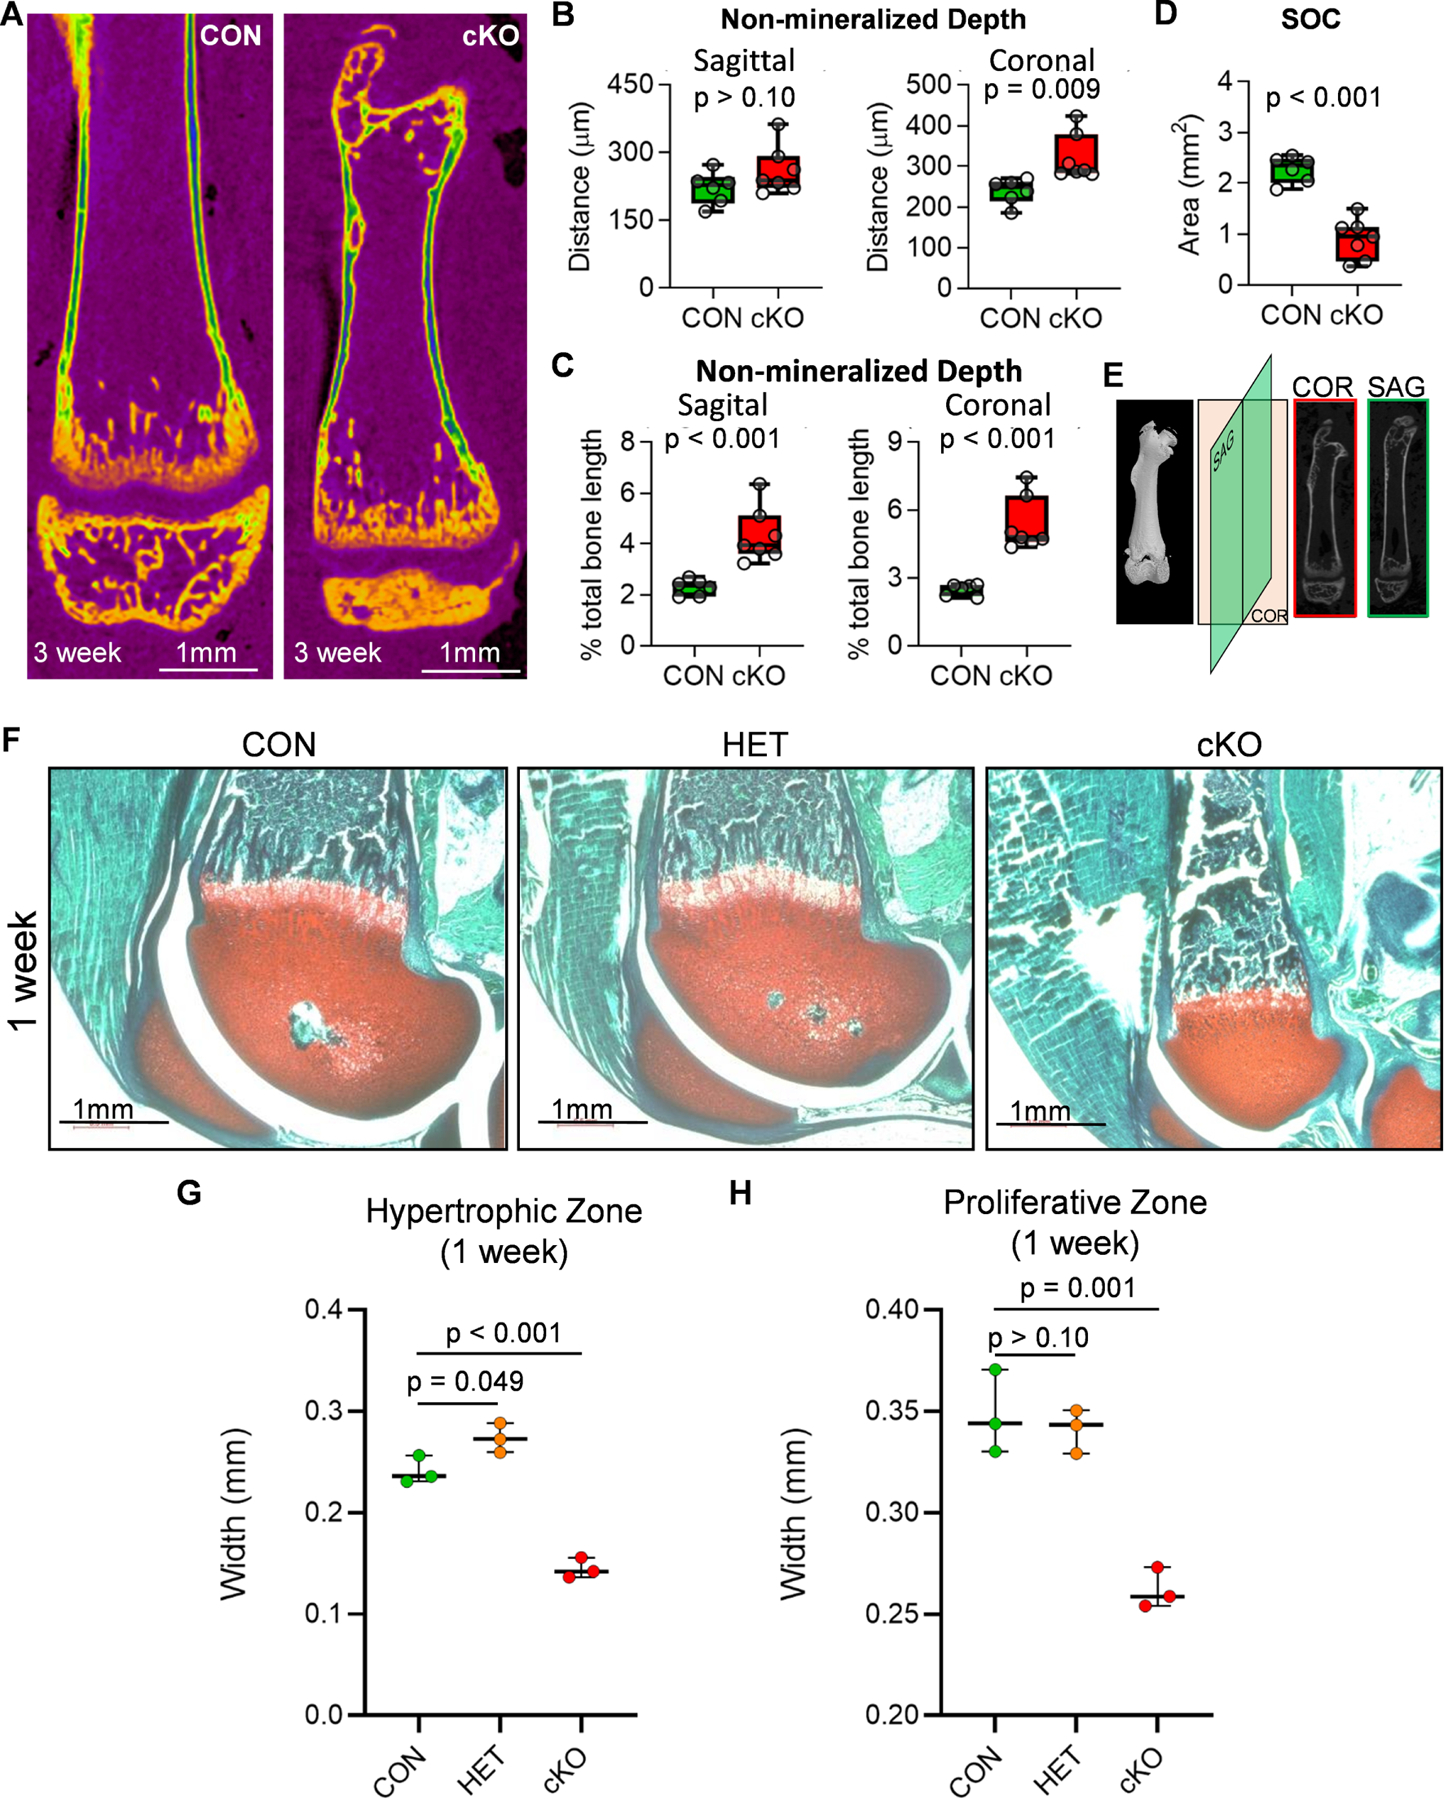
Figure 4. Growth plate alterations in mice lacking mesenchymal Brd4 expression.

Distal femora of three week old CON (Brd4wt/wt: Prrx1-Cre) and cKO (Brd4f l/f l: Prrx1-Cre) female mice were assessed by µCT analysis (n = 6 and 7) (A-E). µCT reconstructions of femora collected from three week old female mice (A). Non-mineralized surface within the growth plate area measured throughout the sagittal (left) and coronal (right) planes (B). Each point represents an average of fifteen measurements taken for each mouse femur. Quantification of non-mineralized surface within growth plate area as a percentage of total femur length obtained from µCT images (C). Area of secondary ossification center (SOC) determined from medial slice of µCT images (D). Schematic depicting orientation of cross sections used to measure non-mineralized surface within the growth plate area of distal femora (E). Trichrome staining of distal femora derived from one week old CON (Brd4wt/wt: Prrx1-Cre), HET (Brd4wt/f l: Prrx1-Cre), and cKO (Brd4f l/f l: Prrx1-Cre) male mice (F). Red = cartilage, blue/green = bone, brown = nuclei. Measurements of hypertrophic (G) and proliferative (H) growth plate zones from trichrome stained sections of one week old male femora (n = 3). Individual measurements are represented by a single point on the graph for each mouse. Boxplots indicate the median, interquartile range, and the minimum and maximum value in each dataset. P-values shown in panels B-D represent the results from unpaired, two-tailed Student’s t-test between CON and cKO groups on each graph. P-values shown in panels G and H represent the results of a one-way ANOVA followed by a multiple comparisons test performed using the Tukey method (correct for multiple comparisons) to compare the means of the indicated groups.
