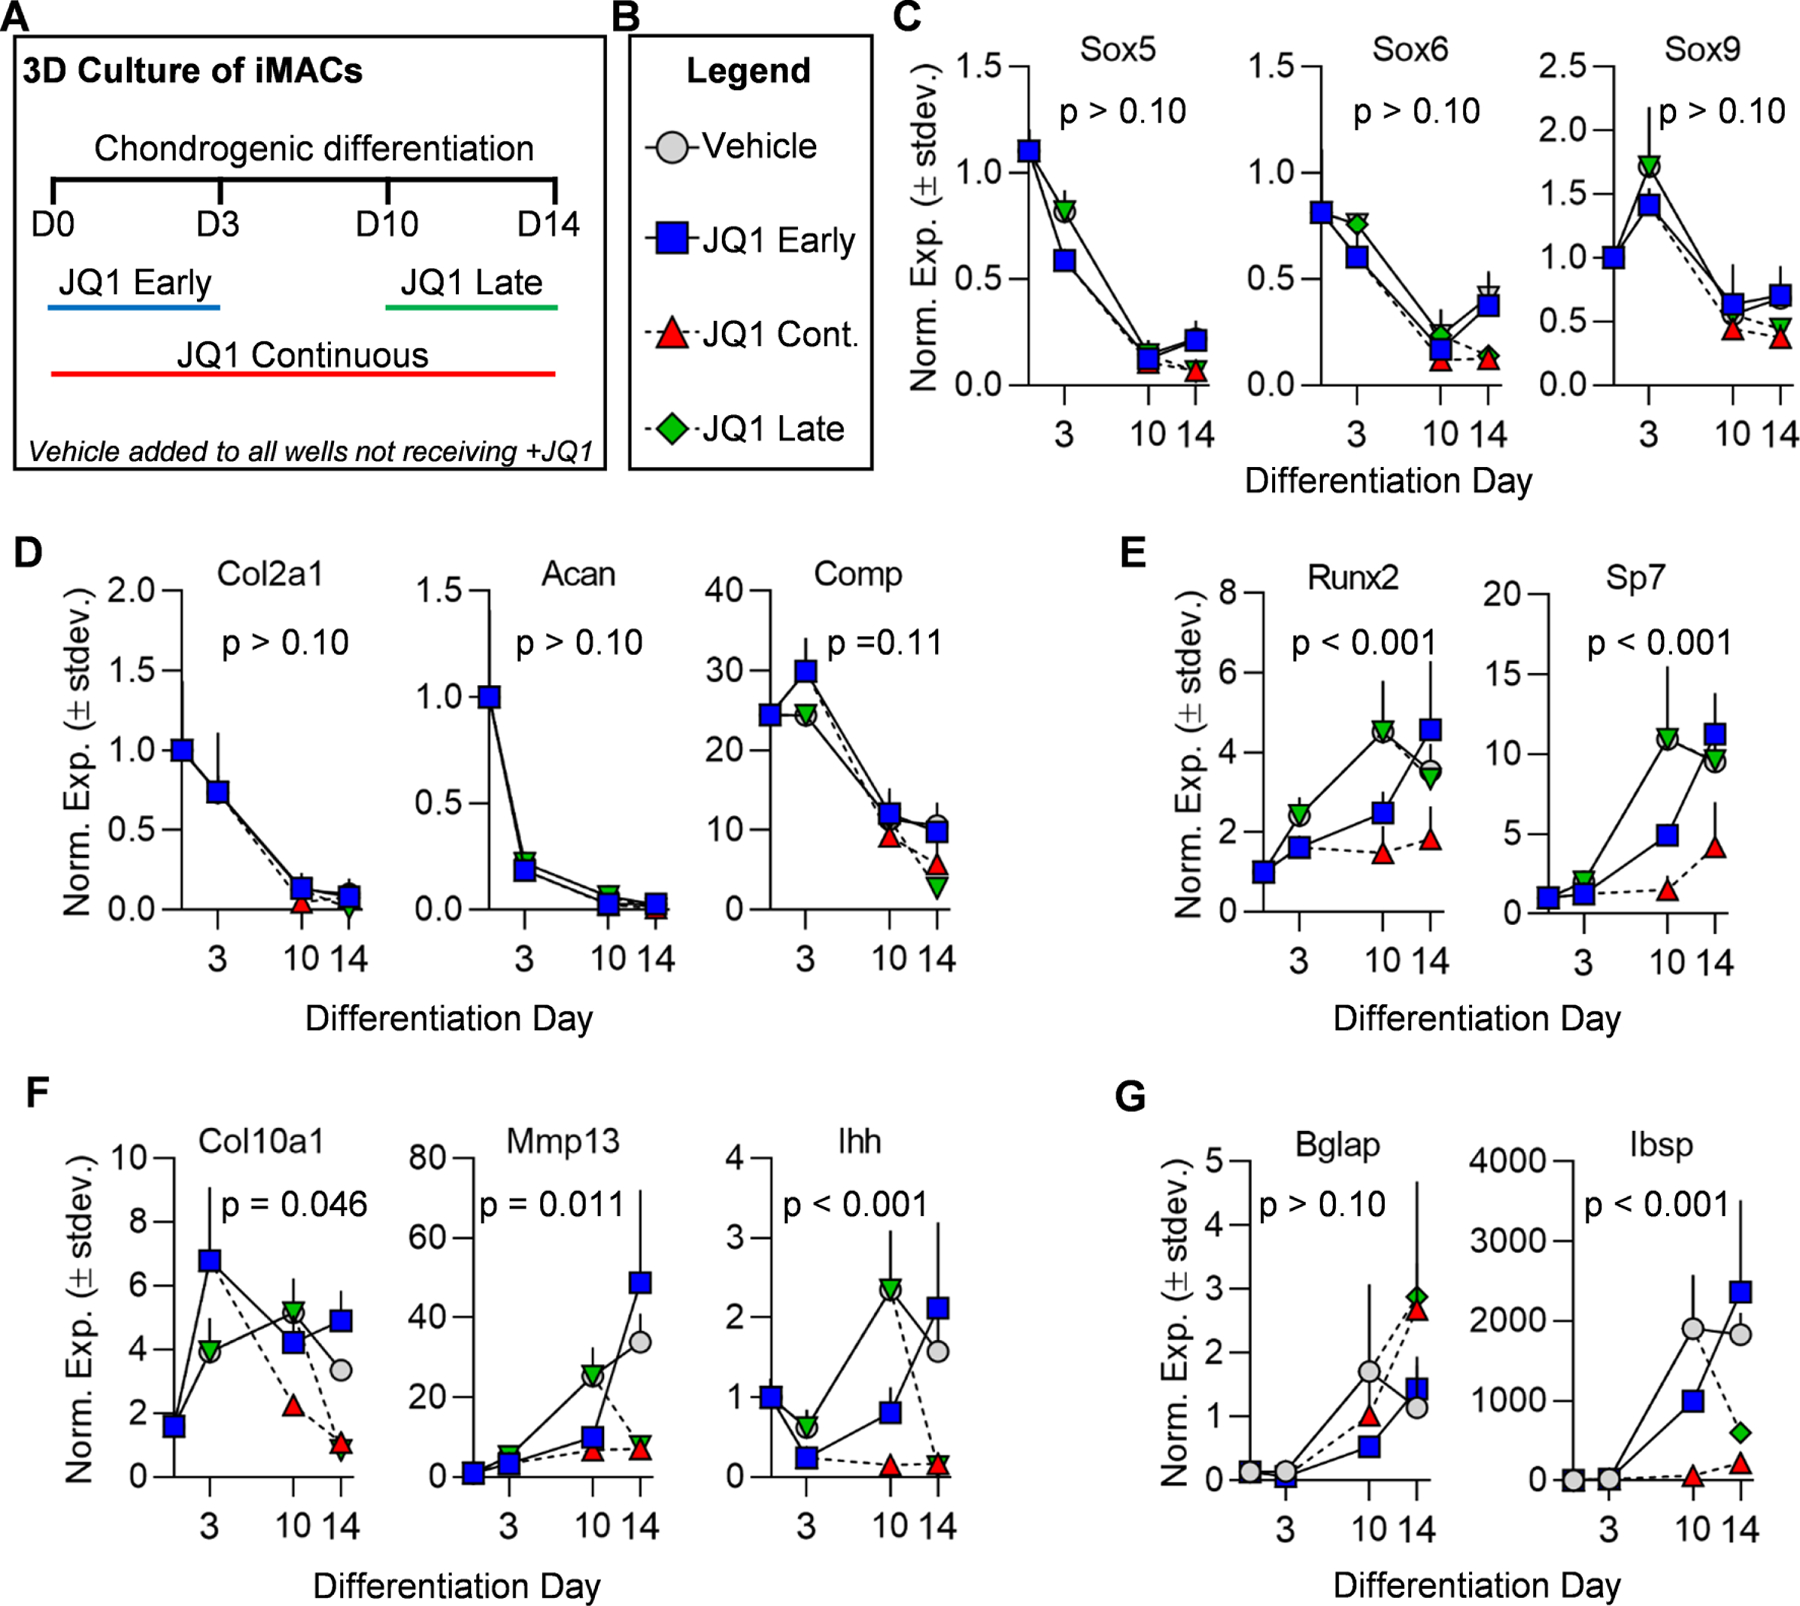
Figure 5. +JQ1 treatment prevents maturation of iMACs.

iMACs were collected from five day-old wild-type C57BL/6J mice and cultured in three-dimensional micromass (3D-µmass) conditions in chondrogenic differentiation media. Schematic of treatment regimen with vehicle (DMSO) control or 100nm +JQ1 (A). Legend indicating treatment groups in subsequent graphs (B). RT-qPCR analysis of chondrogenic transcription factors (C), early chondrogenic markers (D), hypertrophic/osteogenic transcription factors (E), hypertrophic markers (F), and hypertrophic/osteogenic markers (G). Experiments were performed in n = 3 biological replicates and the mean is indicated by each point on the graph. Error bars represent standard deviation and statistical significance is indicated in each panel. A mixed-effects model (REML) analysis was performed for each graph (alpha = 0.05). The p-value reported for the fixed effects was then assessed. For all datasets, the time variable had a statistically significant impact with a p-value < 0.001. The p-value calculated for the “treatment group” variable is reported on each graph.
