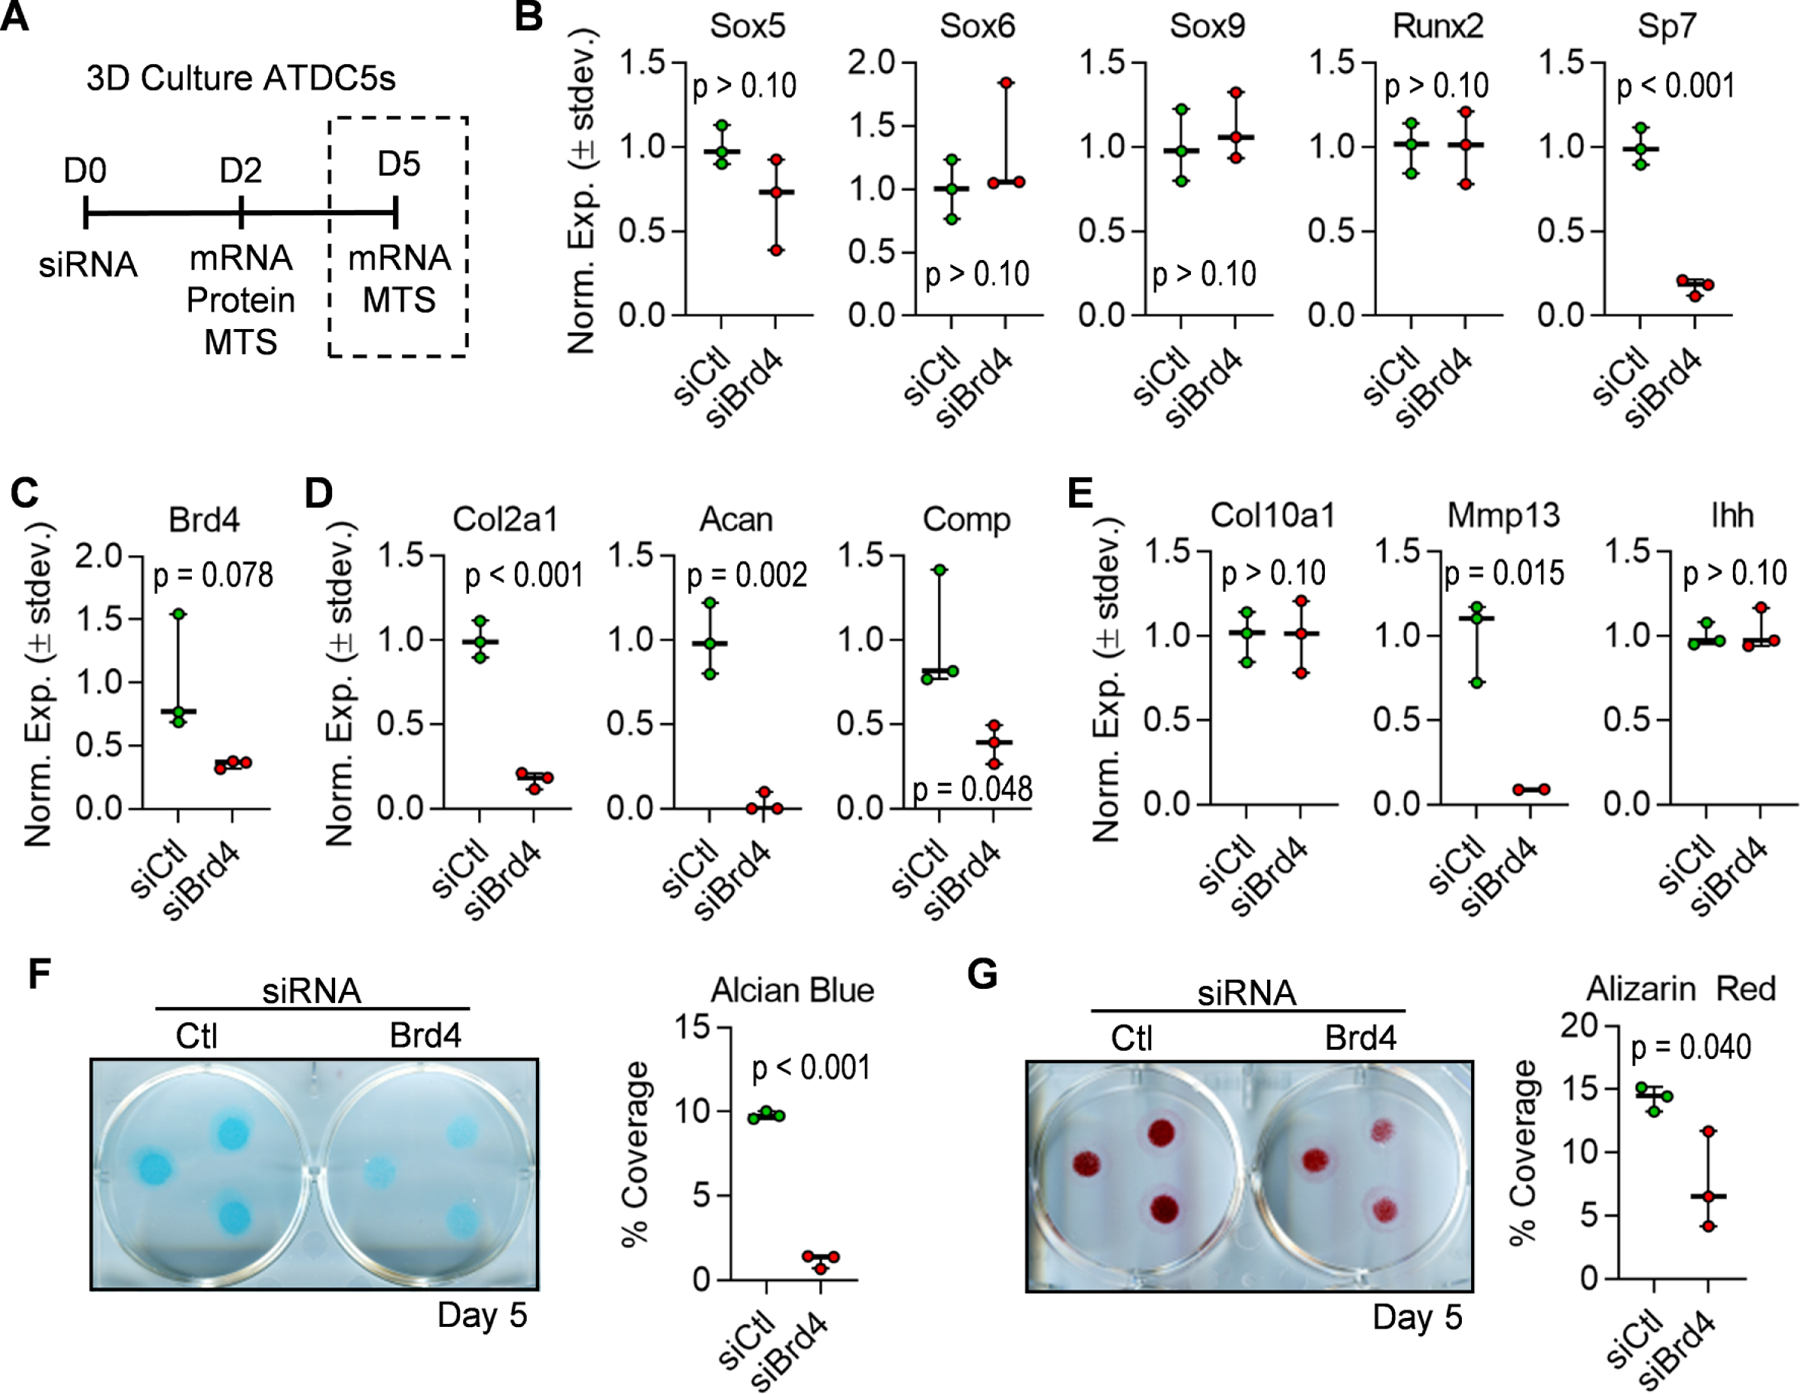
Figure 7. Brd4 knock-down prevents maturation of ATDC5 cells.

ATDC5 cells were transfected with non-targeting siRNA (siCtl) or Brd4-targeting siRNA (siBrd4) and cultured in three-dimensional micromass cultures in chondrogenic differentiation media. Schematic of siRNA transfection experiment and data collection points (A). RT-qPCR analysis of transcription factors (B), Brd4 (C), early chondrogenic genes (D), and hypertrophic genes (E) performed on mRNA isolated five days post-transfection. Alcian Blue staining and quantification performed five days after induction of chondrogenic differentiation (F). Alizarin red staining and quantification performed five days after induction of chondrogenic differentiation (G). For quantification of staining, percent coverage of a 1.13cm2 circle was measured for each micromass (n = 3 micromasses per well). Boxplots indicate the median, interquartile range, and the minimum and maximum value in each dataset (n = 3). Individual biological replicates are represented by a single point on the graph. P-values indicate results from unpaired, two-tailed Student’s t-test between siCtl and siBrd4 groups.
