FIGURE 6.
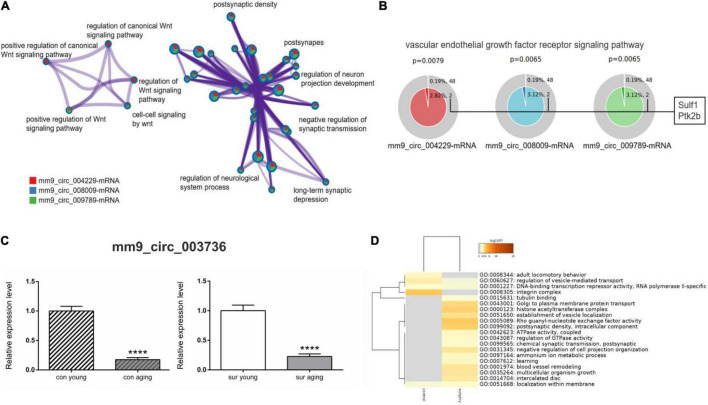
Gene annotation and enrichment of target mRNAs in ceRNA networks. (A,B) The enrichment analysis of target mRNAs derived from mm9_circ_004229/mm9_circ_008009/mm9_circ_009789-associated-ceRNA networks [mm9_circ_004229-mRNA (red), mm9_circ_008009-mRNA (blue) and mm9_circ_009789-mRNA (green)]. (A) Enrichment network constructed by enriched terms. (B) Enriched GO term: “Vascular endothelial growth factor receptor signaling pathway” (GO:0048010). The term related mRNAs are as shown in the figure. P < 0.05 is considered as statistically significant. (C,D) The analysis of mm9_circ_003736-associated-ceRNA network. (C) Real-time qPCR to analysis the expression of mm9_circ_003736 in young and aging mice under control and anesthesia/surgery conditions. ****p < 0.0001. All data are presented as mean ± SEM (n = 6). (D) The enrichment analysis of target mRNAs derived from mm9_circ_003736-associated-ceRNA networks under control and anesthesia/surgery conditions. Heatmap representing the differences between control and anesthesia/surgery conditions, colored by p-values, as shown in the legend above. The darker the color, the more statistically significant the term is. Gray indicates no enrichment in the corresponding term, P > 0.05.

