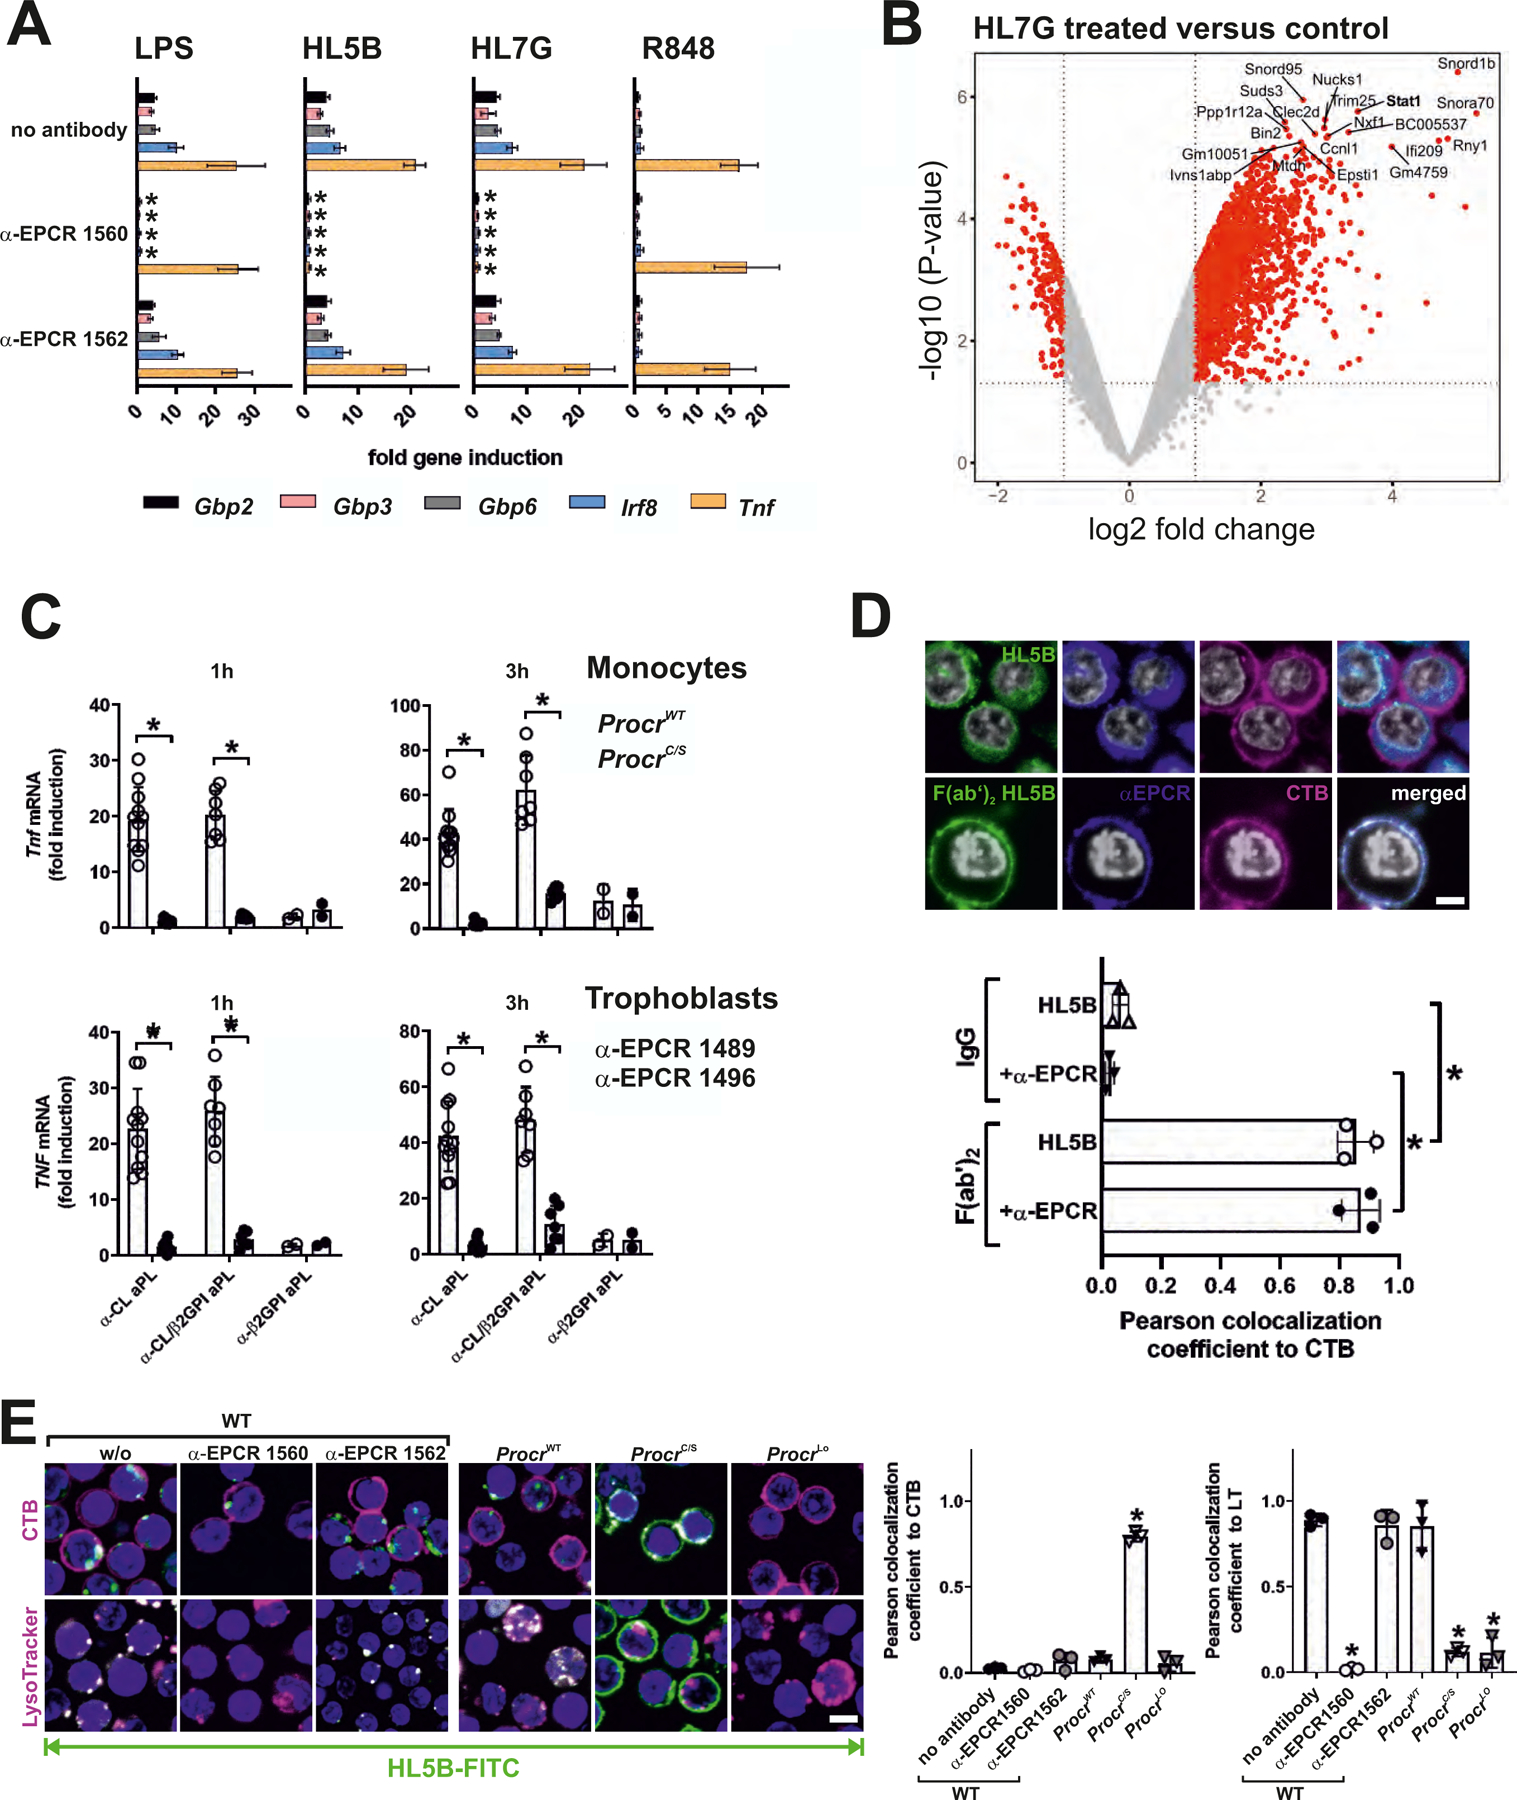
Figure 1: EPCR is an aPL receptor.

(A) EPCR-dependent induction of IFN-regulated genes and Tnf in mouse monocytes after 1 hour of stimulation with LPS, aPL HL5B, aPL HL7G, or TLR7 agonist R848; relative expression induced by aPLs was normalized to IgG isotype control; n=6, *P<0.05 compared to stimulation without inhibitor; two-way ANOVA, Sidak’s multiple comparisons test. (B) Volcano plot of aPL HL7G-induced transcripts, including Stat1, a known IFN-regulated gene. (C) Induction of Tnf in CD115+ splenic monocytes from ProcrC/S or strain matched ProcrWT mice (upper panel) and human trophoblast cells (lower panel) stimulated for 1 or 3 hours with IgG (100 µg/ml) isolated from APS patients with confirmed reactivity to cardiolipin alone (α-CL), β2GPI alone (α-β2GPI), or dual reactivity (α-CL/β2GP). Human trophoblast cells were pretreated with either non-inhibitory α-EPCR 1489 or inhibitory α-EPCR 1496; *P<0.0001; one-way ANOVA. (D) Live-cell imaging of aPL HL5B IgG or F(ab′)2 colocalization (green) with cholera toxin B (CTB; magenta) or EPCR (blue) using non-inhibitory α-EPCR 1489 in human MM1 cells. Nuclei were stained with Hoechst 33342 (gray). Quantification of colocalization; n=3 ROI (regions of interest) consisting of at least three cells, *P<0.0001; one-way ANOVA. (E) Live-cell imaging of HL5B internalization (green) in monocytes of the indicated mouse strains with CTB or LysoTracker counterstaining (magenta). Nuclei were stained with Hoechst 33342 (blue); bar=5 µm; n=3 ROI, *P<0.0001; one-way ANOVA.
