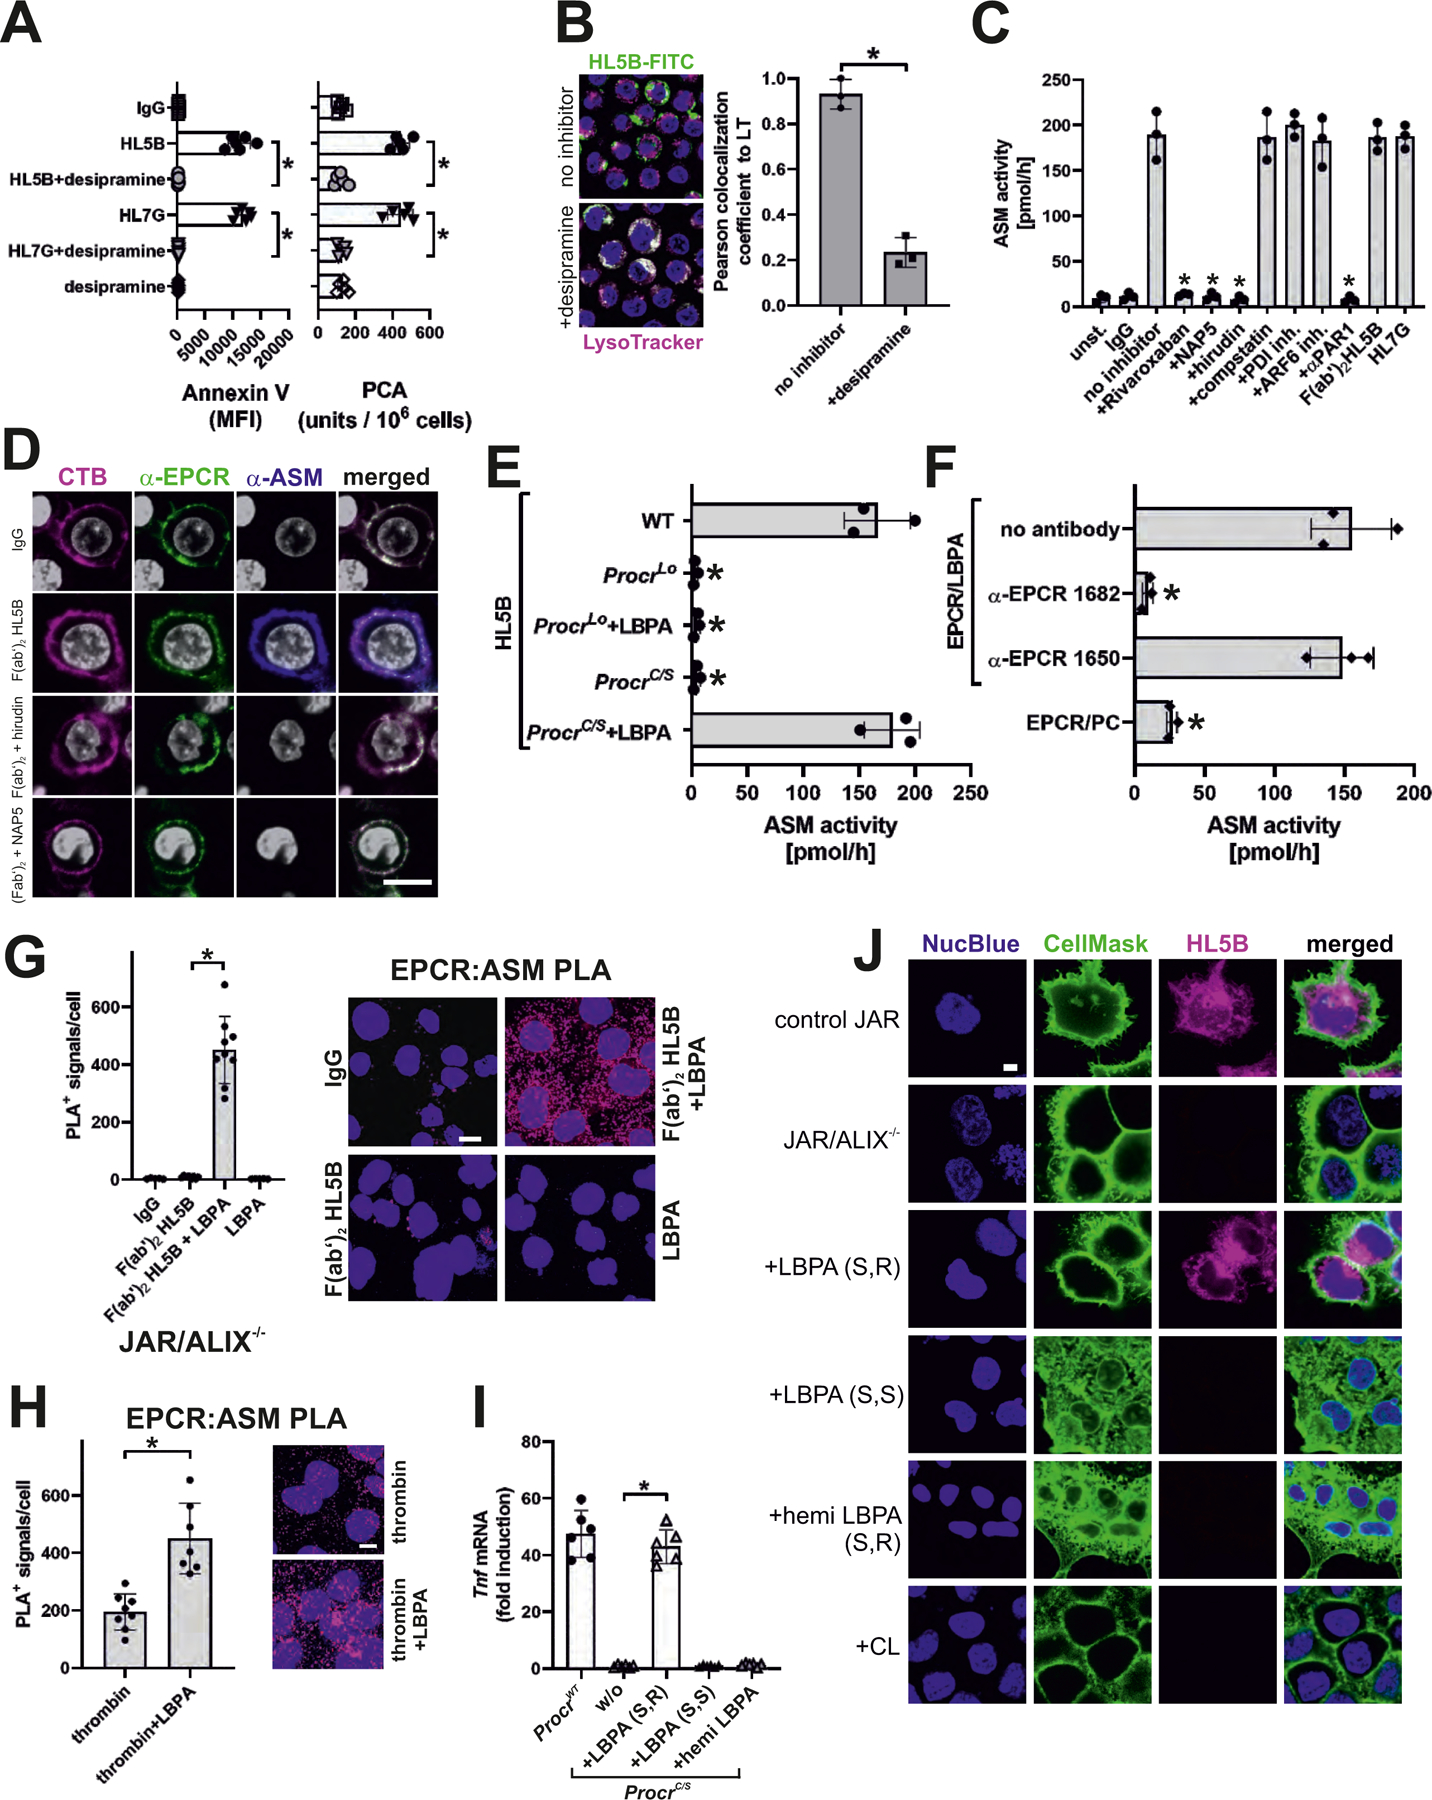
Figure 3: aPLs induce EPCR–LBPA activation of cell surface ASM.

(A) aPL-mediated phosphatidylserine exposure (measured by Annexin V-FITC staining) and aPL-mediated TF activation in MM1 cells (measured as procoagulant activity, PCA) were prevented by desipramine; n=6, *P<0.0001; one-way ANOVA. (B) aPL internalization in MM1 cells is blocked by sphingomyelinase inhibitor desipramine. Bar=5 µm. Quantification of colocalization; n=3 ROI consisting of at least three cells, *P=0.002; t-test. (C) aPL-induced ASM activity in MM1 cells is blocked by inhibitors of FXa (Rivaroxaban, NAP5), thrombin (hirudin), and PAR1 cleavage (αPAR1, ATAP2/WEDE15) but not by inhibitors of complement (compstatin), PDI and ARF6; n=3, *P<0.0001; one-way ANOVA. (D) Surface ASM exposure in MM1 cells after 30 min of stimulation with aPL HL5B F(ab′)2. Scale bar=5 µm. Live-cell imaging of EPCR colocalization (green) with cholera toxin B (CTB; magenta) or ASM (blue). Nuclei were stained with Hoechst 33342 (gray). (E) LBPA (10 µM) loading of mouse ProcrC/S cells enables ASM activation in CD115+ monocytes stimulated with HL5B; n=3, *P<0.0001; one-way ANOVA. (F) ASM activity in unstimulated mouse monocytes lysates after addition of sEPCR–LBPA (2.5 µM) is blocked by α-EPCR–LBPA 1682; n=3, *P<0.0001; one-way ANOVA. (G, H) Proximity ligation assays (PLA) with magenta fluorescence dots for ASM and EPCR on ALIX−/− trophoblast cells after 10 min of stimulation with aPL HL5B F(ab′)2 fragments (G) or thrombin (H) with or without LBPA loading. Nuclei were stained with Hoechst 33342 (blue) Scale bar=25 µm. (I) aPL HL5B signaling in ProcrC/S monocytes was restored by adding 10 µM LBPA (S,R), but not by LBPA (S,S) or hemi LBPA. Stimulation time 3 hours; n=6, *P<0.0001; one-way ANOVA. (J) aPL HL5B internalization in ALIX-deficient JAR cells after pretreatment with the indicated phospholipids at 10 µM. Scale bar=5 µm.
