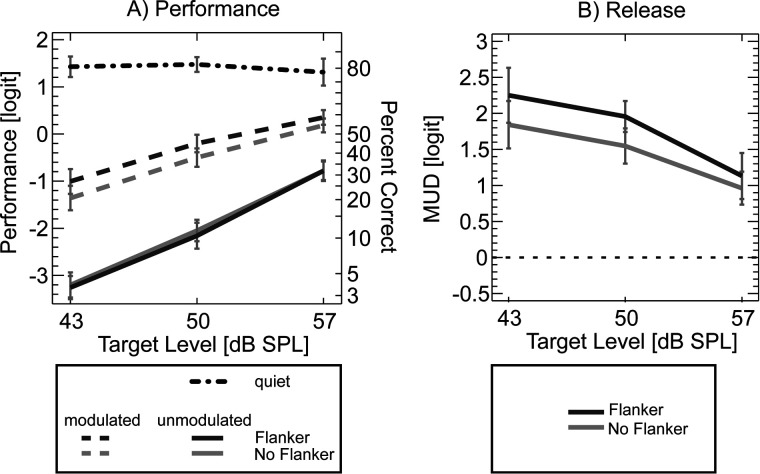
FIG. 2.
(A) Mean performance in unmodulated versus modulated noise (solid versus dashed lines, respectively) and for on-target and on-target plus flanking band noise maskers (light versus dark gray lines, respectively) of Experiment 1. The dotted-dashed line shows performance in quiet. Left ordinate shows performance in logit units, right ordinate in percent correct. (B) Mean MUD in logit units. Error bars show 95% confidence intervals of the across-listener mean, after subtracting between-listeners variance. Note that (A) and (B) do not use the same ordinate scaling.

