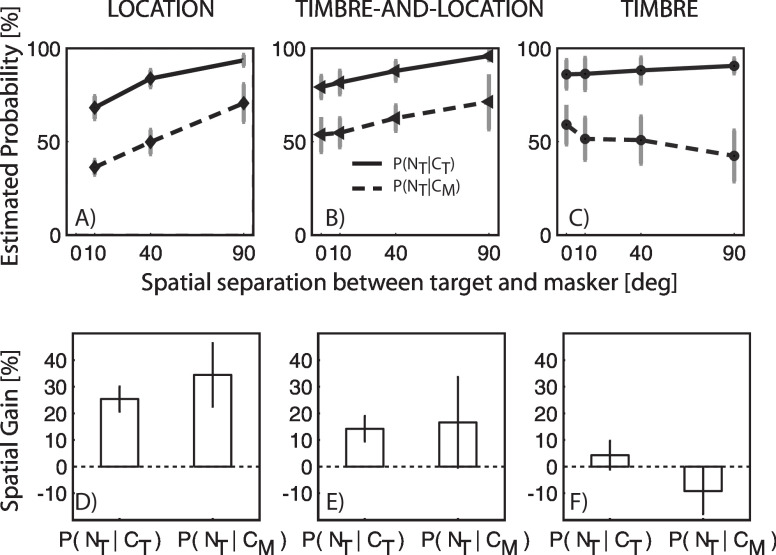
FIG. 6.
Results of the probabilistic analysis from Eqs. (1)–(4). [(A)–(C)] Across-subject mean of the conditional probabilities, as a function of spatial separation (error bars show the standard error of the mean). [(C)–(E)] Across-subject mean of the percent spatial gain in conditional probabilities, respectively, with spatial separation for the three conditions (error bars show 95% confidence intervals).

