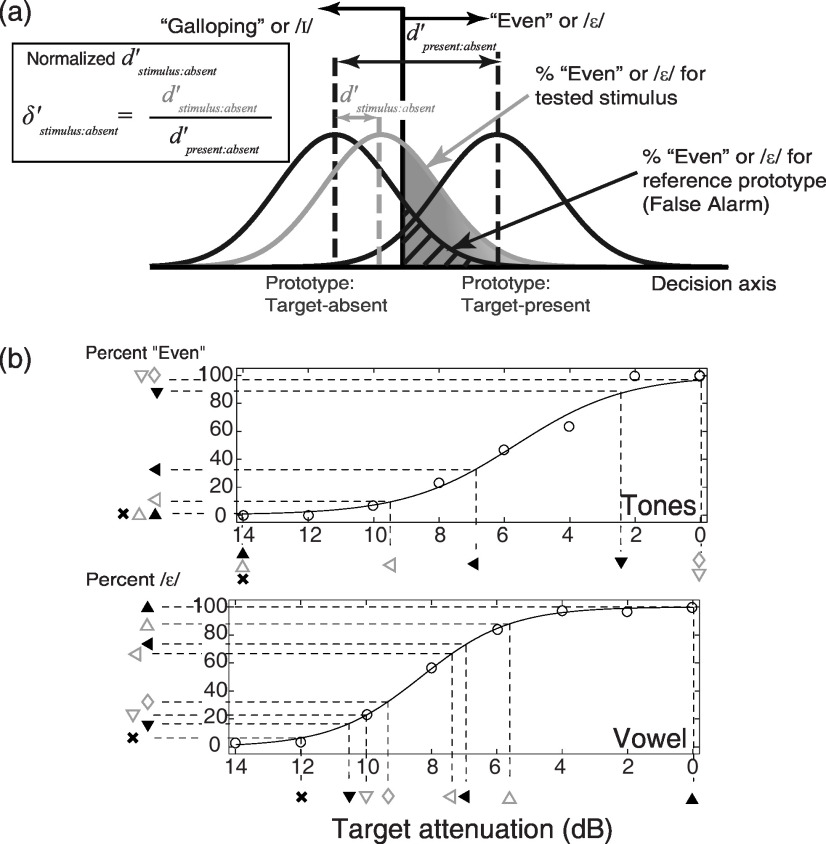
FIG. 3.
(a) Schematics of the decision model assumed in computing . The decision axis (representing the decision variable for either the rhythmic or vowel identification space) is shown along the abscissa. The Gaussian distributions show the conditional probabilities of observing different values of the decision variable for the target-absent and target-present prototypes (left and right distributions, respectively) as well as for a particular two-object stimulus (middle distribution). (b) Computation of the effective target attenuation from the psychometric functions relating percent target-present responses to physical target attenuation for one-object stimuli for an example subject. The solid line shows the psychometric function fitted to the data points from the one-object control experiment, plotted as circles. The symbols on the ordinate and horizontal dashed lines represent the percentage of even (top panel) or (bottom panel) responses for different stimuli. The vertical dashed lines and symbols along the abscissa show the effective target attenuation estimated from the control data.

