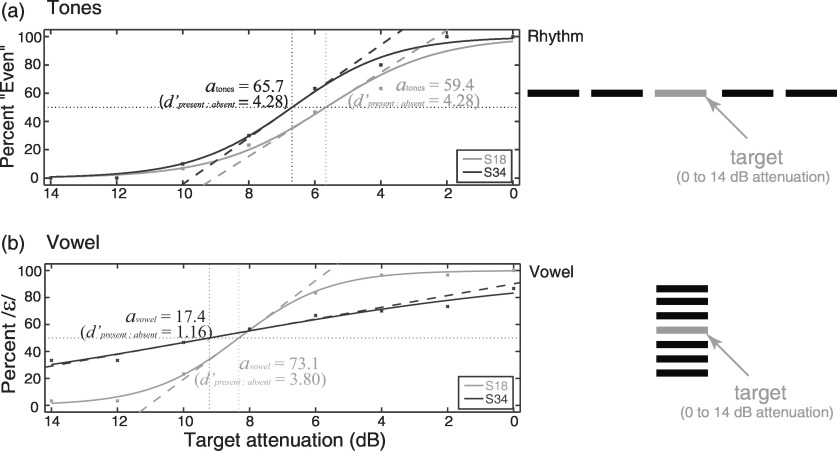
FIG. 4.
Example psychometric functions for results of one-object experiments in which the target attenuation varied from 0 to (in steps), for two representative subjects (S18, a good subject, and S34, a subject who just passed our screening criteria). The dotted lines show the slope of each of the psychometric function at the 50% point. The raw percent responses (for tone-stream rhythm on top and vowel identity below) are shown for each subject as a function of target attenuation.

