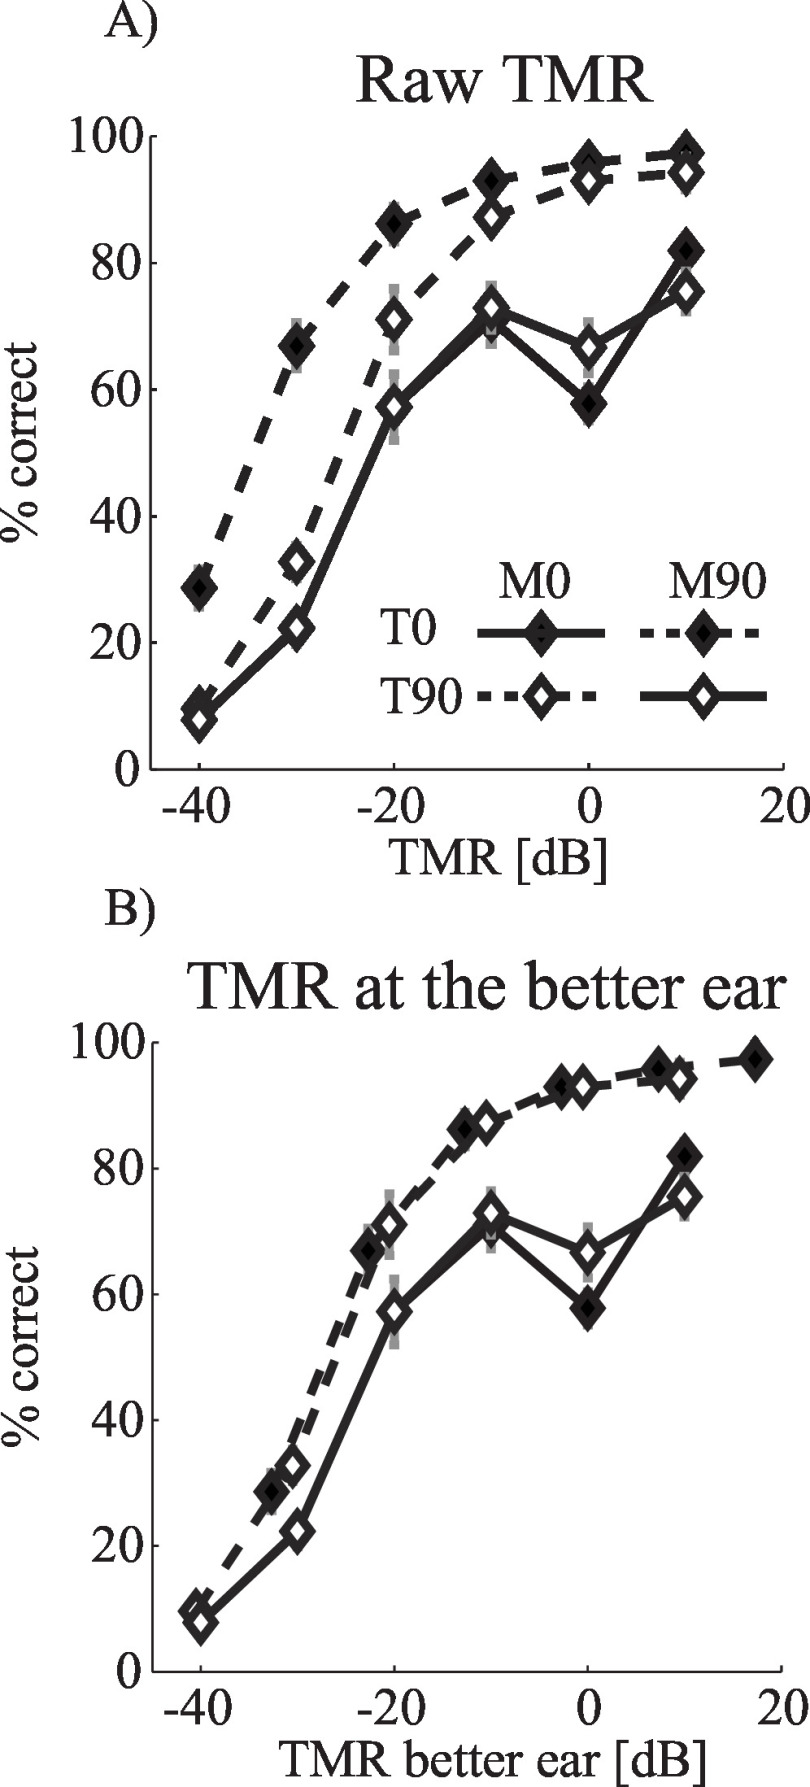
FIG. 2.
Overall percent correct as a function of the TMR for the four tested spatial configurations, averaged across subjects. In general, performance improves with TMR, and is better for spatially separated than co-located sources. Error bars show the across-subject standard error of the mean. Filled symbols show results for the target at 0°, open symbols for the target at 90°. Results for spatially separated target and masker are shown with dashed lines. Results for co-located sources are shown with solid lines. (a) Results plotted as a function of the broadband target to masker ratio (TMR). (b) The same results re-plotted as a function of (correcting for differences in the acoustic TMR at the better ear).

