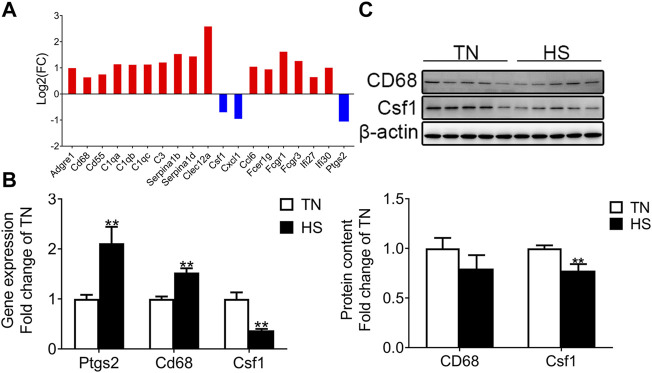
FIGURE 2.
Effects of HS during late gestation on the expression of genes enriched in immune response in the placenta. Fold change of DEGs (A), mRNA expression (B), and protein levels (TN: n = 11; HS: n = 8) (C) in the placenta. Gene symbols are shown on the x-axis, and log2 FC is shown on the y-axis. Blue bar: down-regulation; red bar: up-regulation. Data are presented as mean ± SEM. *p < 0.05, **p < 0.01.

