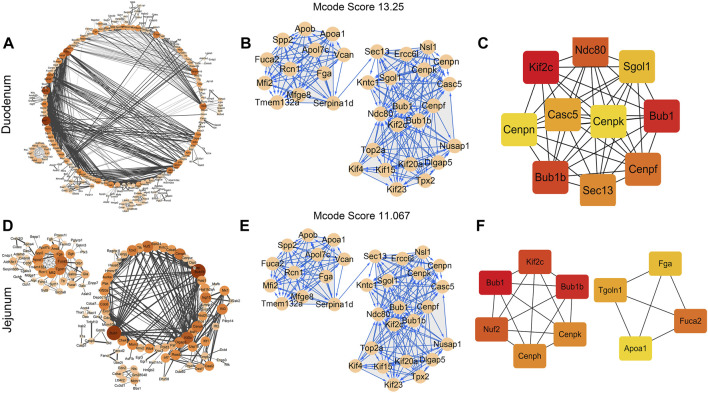
FIGURE 4.
Protein–protein interaction (PPI) network and hub gene analysis of DEGs in the fetal duodenum and jejunum. (A) PPI network interaction in the fetal duodenum. Interactions are indicated by edges, with thicker edges having stronger associations. MCODE cluster of PPI networks (B) and the top 10 hub genes (C) in the fetal duodenum. PPI network interaction (D), MCODE cluster of PPI networks (E), and the top 10 hub genes (F) in the fetal jejunum. The color of the node represents the clustering coefficient. The size of each node is proportional to the number of degrees. Interactions are indicated by edges, with thicker edges having stronger associations. Different colors represent the differing importance of the hub genes, in terms of their degree of connectivity. Higher ranks are represented by a deeper color.

