
Fig. 6. Comparison of HIV env sequences and clonal composition over time revealed no evidence of clonal expansion.
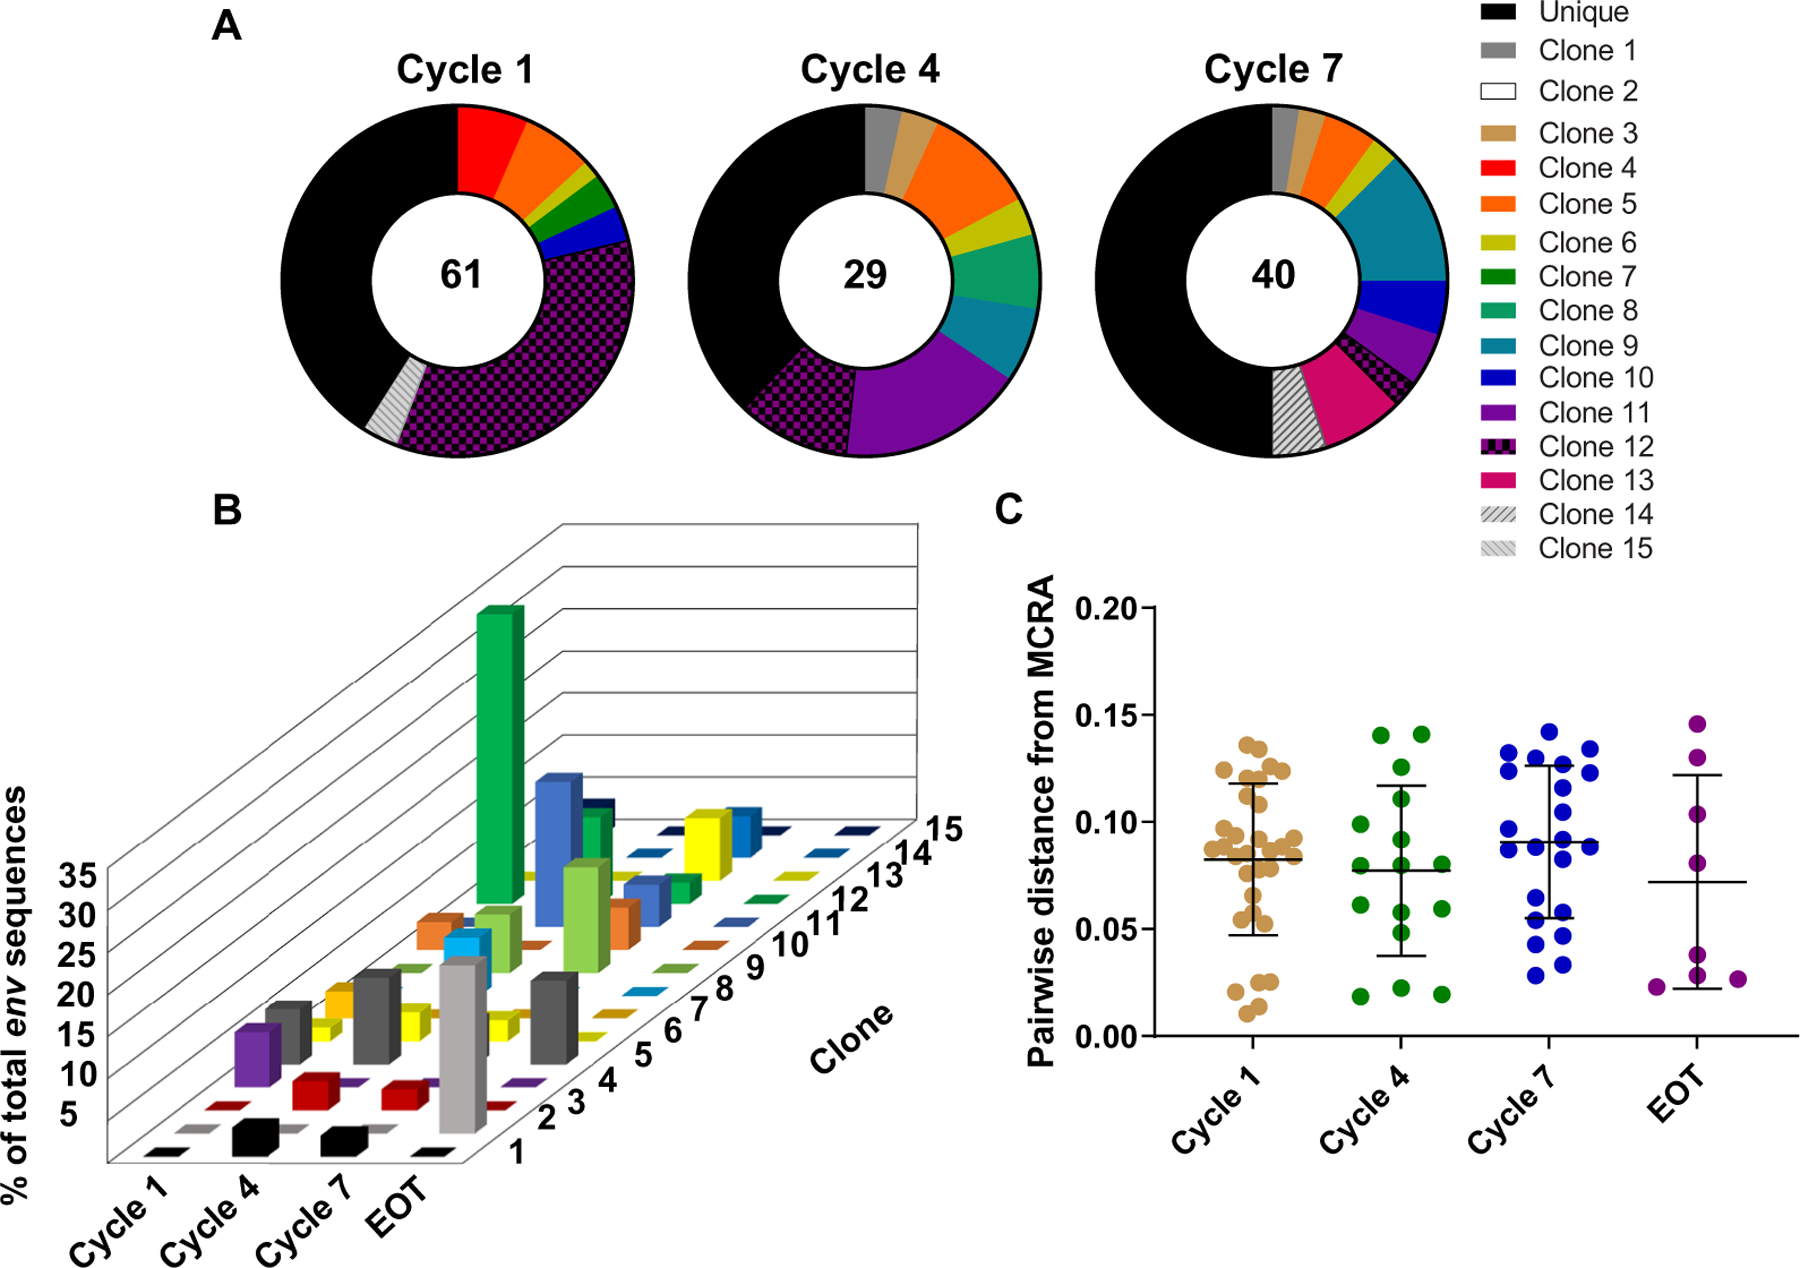
(A) The proportional distribution of 13 clones over four time points (cycle 1, cycle 4, cycle 7, and EOT) is shown. Clones are represented by color. (B) The percent of total env sequence at each time point are shown. Clone 12, which represented 34.4% of all clones at baseline, declined proportionally over time. (C) Pairwise distance analyses of distance from most recent common ancestor (MRCA) reveal no significant change over time. Data are presented as means and SD.