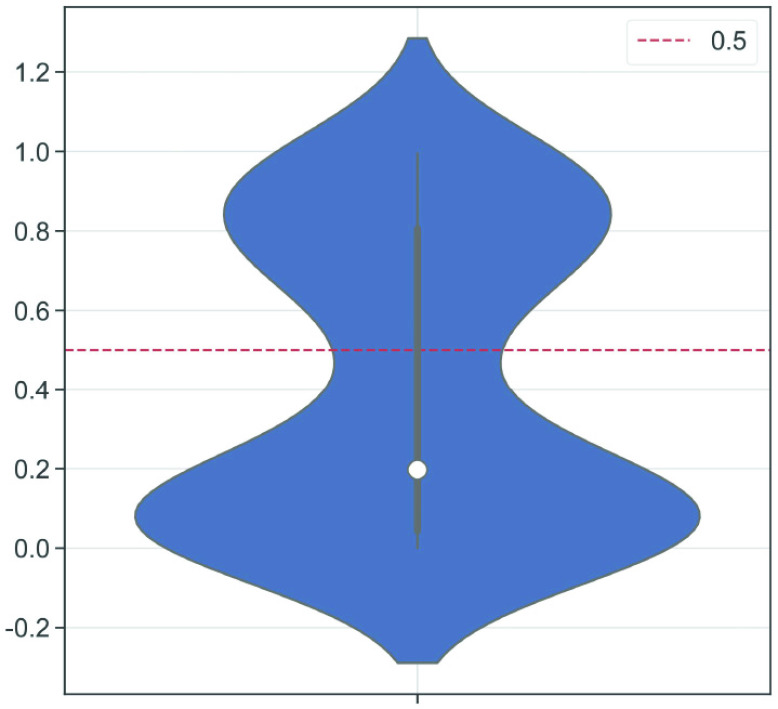
Fig. 5.
Absolute value of the correlation coefficient between features and the predictive value: the white point is the median value of data; the upper and lower bounds of the middle black box represent the upper and lower quartiles of the correlation coefficients, respectively; the upper and lower bounds of the middle black line represent the maximum and minimum values of the correlation coefficients; the shape of the violin indicates the frequency (or estimated probability distribution) of correlation coefficients.

