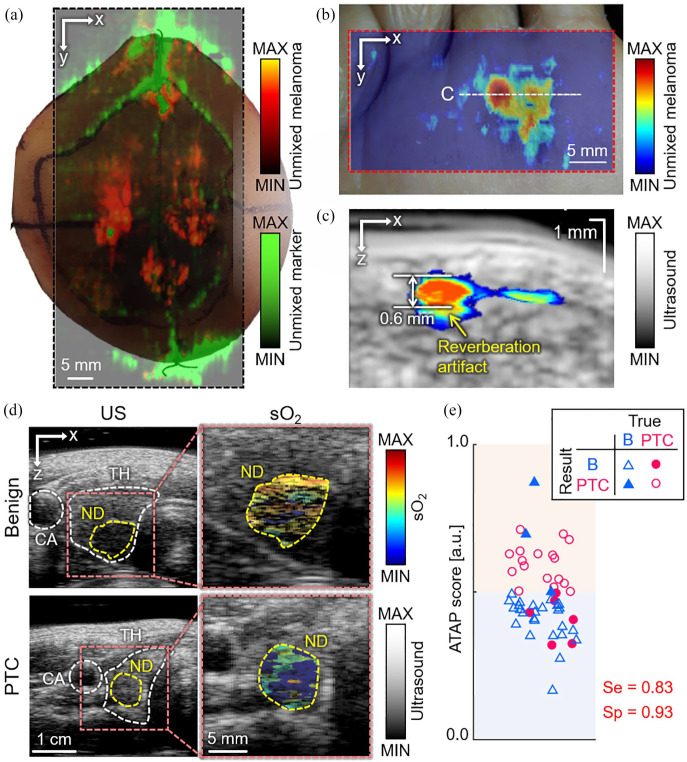
Figure 5.
Multispectral PA imaging results of cancer region in vivo. (a) Multispectral PA images delineating melanoma and marker pen in excised human tissue. (b) Maximum amplitude projection of melanoma signal from the spectral unmixing of the multispectral PA responses in vivo. (c) Cross-sectional PA and US image of the position of white dashed line in (b). (d) sO2 distribution in thyroid nodules from the representative benign and PTC patients. (e) Classification result of thyroid nodules using a novel ATAP scoring method. Red and blue area denote decision results as PTC and benign, respectively. PA: photoacoustic; US: ultrasound; PTC: papillary thyroid cancer; B: benign; sO2: hemoglobin oxygen saturation; CA: carotid artery; TH: thyroid; ND: nodule; ATAP: the American Thyroid Association and the photoacoustic probability of PTC; Se: sensitivity; Sp: specificity. The images are reproduced with permission from Kim and colleagues.35,38,39 (A color version of this figure is available in the online journal.)

