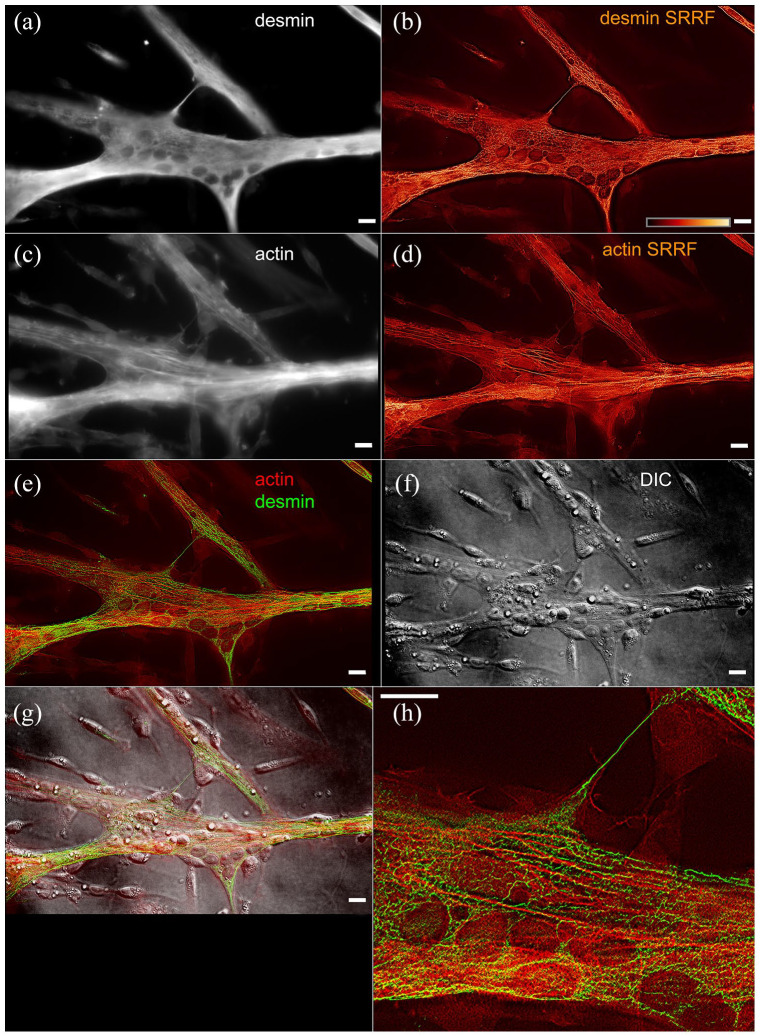
Figure 1.
Immunofluorescence labeling of chick primary culture myoblasts for desmin (a) and actin (c), and images processed with SRRF for desmin (b) and actin (d). The merged image (e) shows desmin labeled in green and actin labeled in red, compared with the interference contrast image (f) and (g)—the superposition of immuno and contrast. In the inset (h), it is interesting to note how the distribution of the processed image of actin and desmin mostly exclude each other. Scale bars 10 µm. (A color version of this figure is available in the online journal.)

