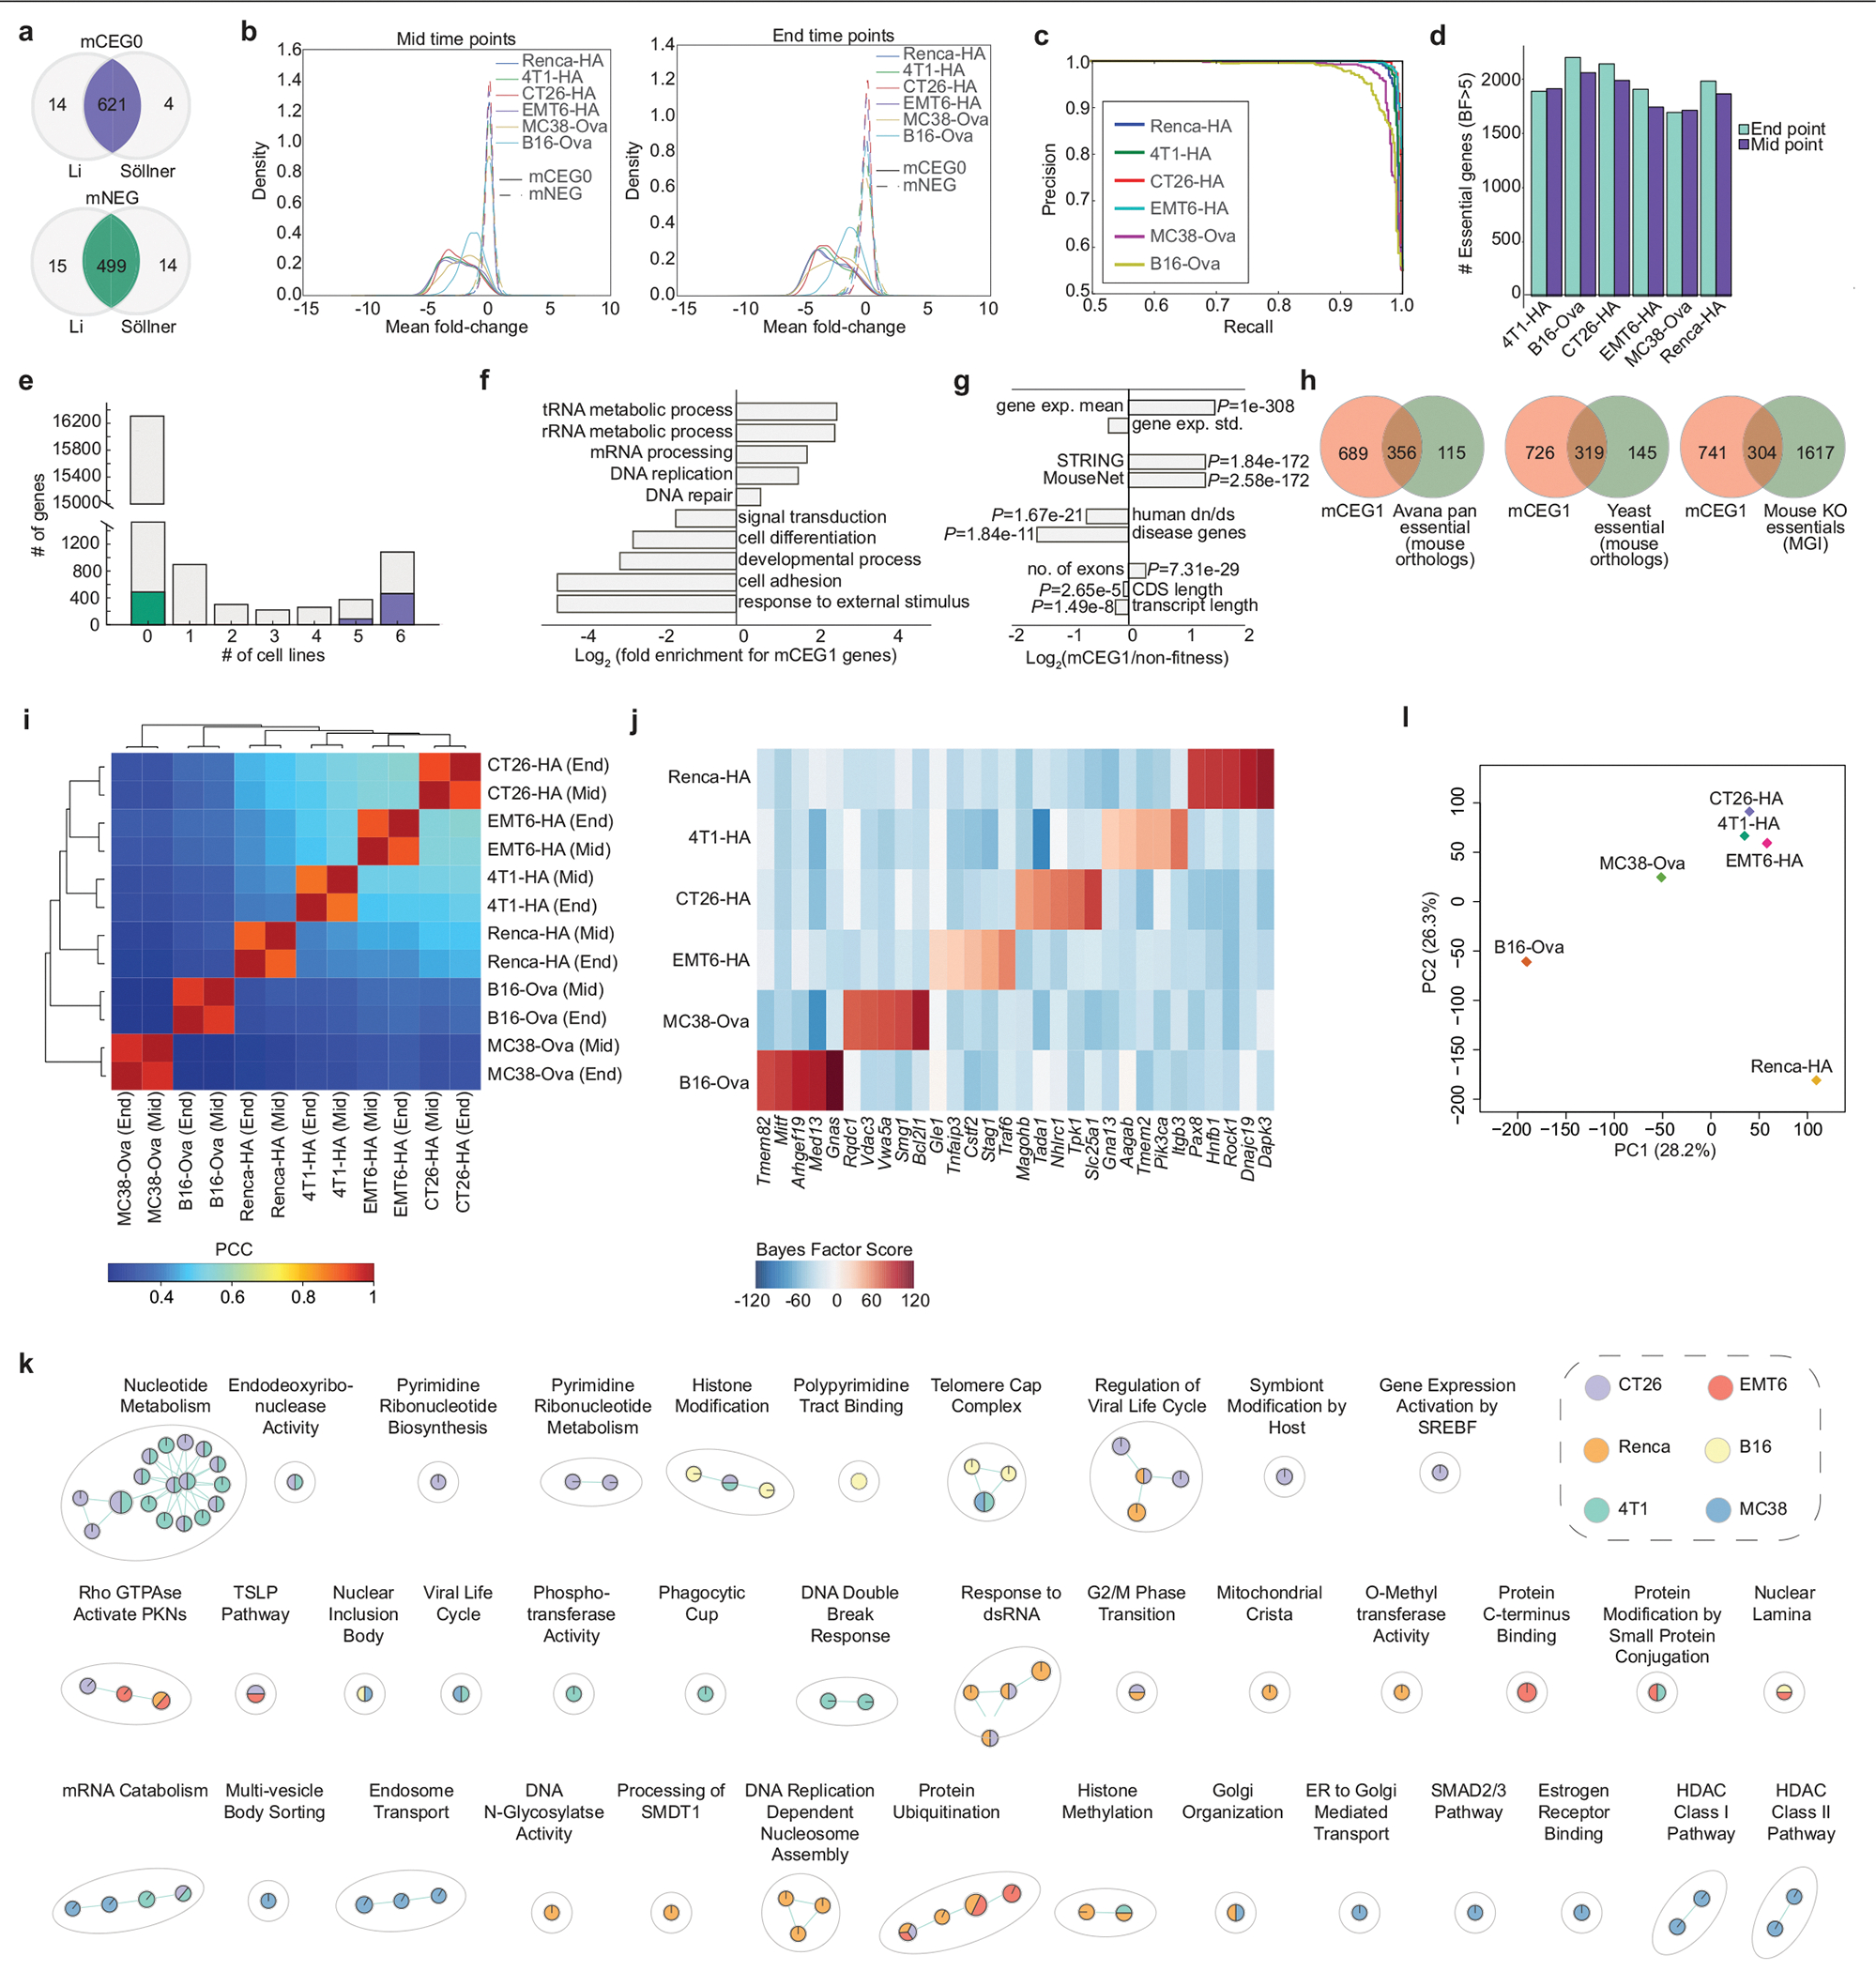
Extended Data Fig. 1 |. Assessment of core and context-specific mouse fitness genes with the mTKO library.

a, Overlap of mouse core essential genes (mCEG0) and non-essential genes (mNEG), indicated in purple and green, respectively, that are orthologous to the corresponding human gene sets, as determined from either the Li or Söllner datasets. b, Mean fold change distributions of core essential genes (mCEG0) or non-essential genes (mNEG0) across the indicated screens at mid and end time points, where fold change is calculated as log2(normalized read counts from early or late time points) −log2(normalized T0 read counts). c, Precision-recall plots derived using the reference essential (mCEG0) and non-essential (mNEG) gene sets for the indicated screens. d, Number of genes with BF >5 at mid and late time points across all screens. e, Number of essential genes (BF >5) across the six cell lines assayed with the mTKO library. Genes in the mCEG0 or mNEG gene sets described in part A are indicated as purple or green stacks in their respective bars. f, Selected biological processes enriched or depleted in the mTKO core essential genes as defined by the mCEG1 gene set (FDR <5%). g, General biological properties of the mTKO core essential genes, plotted as fold-change of the mCEG1 gene set relative to reference non-essential genes. One sided Fisher’s exact test was used for calculating P values of disease genes and two-sample Kolmogorov-Smirmov test for other features. h, Overlap of mCEG1 genes with other reference essential gene lists from human, yeast and whole-organism mouse knockout studies. i, Correlation and unsupervised clustering of genotype-specific essential gene profiles across all cell lines and time points. j, BF scores for top 5 genotype-specific essential genes for each cell line. k, Pathways enriched at FDR < 5% uniquely in fewer than three cell lines, as identified by GSEA analysis on rank-ordered essential genes from each screen. l, Principal component analysis of transcriptomic data for replicate samples from each cell line.
