
Extended Data Fig. 4 |. Additional data for Adar.
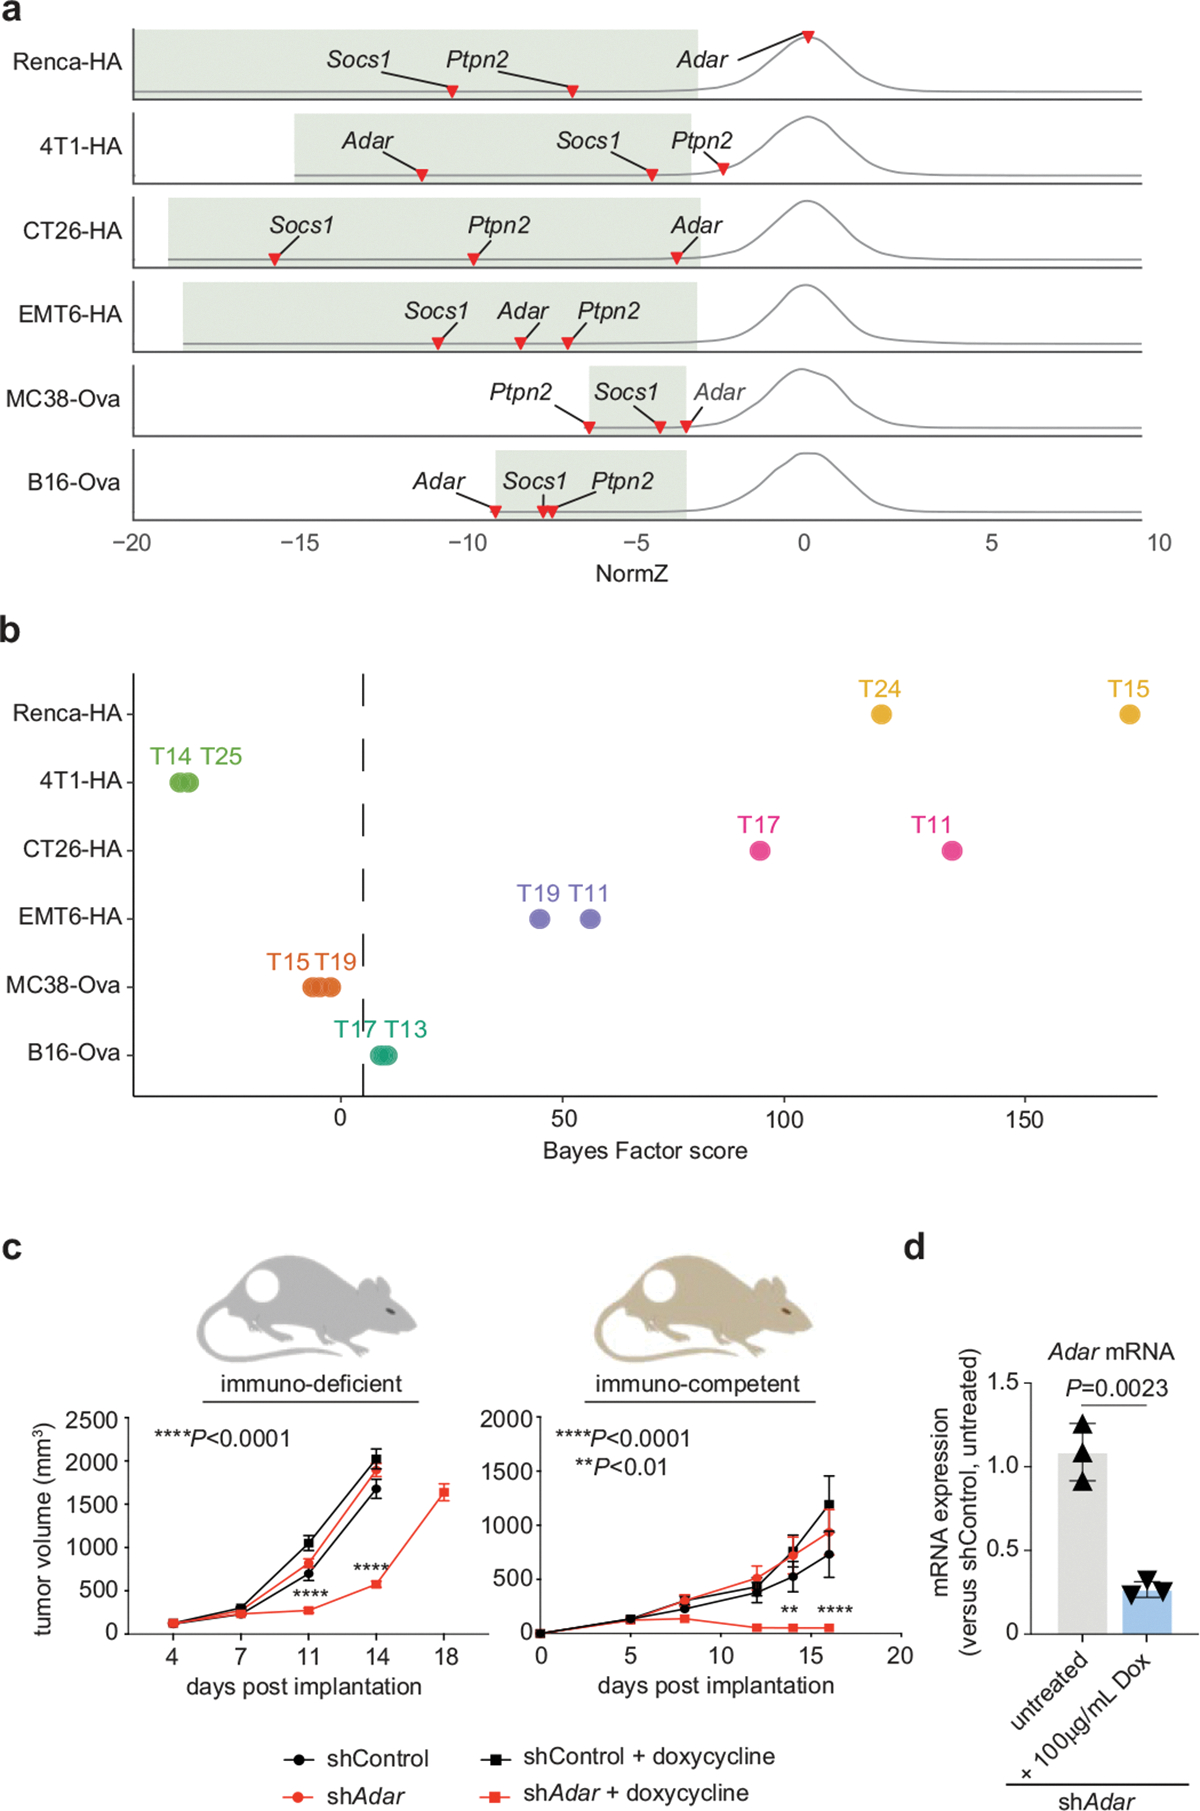
a, Distribution of gene-level NormZ scores for all six CTL killing screens. Well-characterized core CTL killing genes including Socs1, Ptpn2 and Adar are indicated for each screen, and green boxes highlight the FDR <5% window for sensitizing hits. b, BF values for Adar across each cell line. c, Tumour burden in B16F10 bearing immunodeficient (left) or immunocompetent (right) mice following dox-induced shRNA-mediated knockdown of Adar (red) or control (black) (n = 10 mice per group). Error bars, s.e.m. Dox-treated mice are indicated by squares and non-treated controls are indicated by circles. d, qPCR analyses of Adar mRNA levels following dox-induced shRNA knockdown, as quantified by Taqman assay. Error bars, s.d.; technical triplicates of one experiment. Two-way ANOVA with Fisher’s LSD comparison.