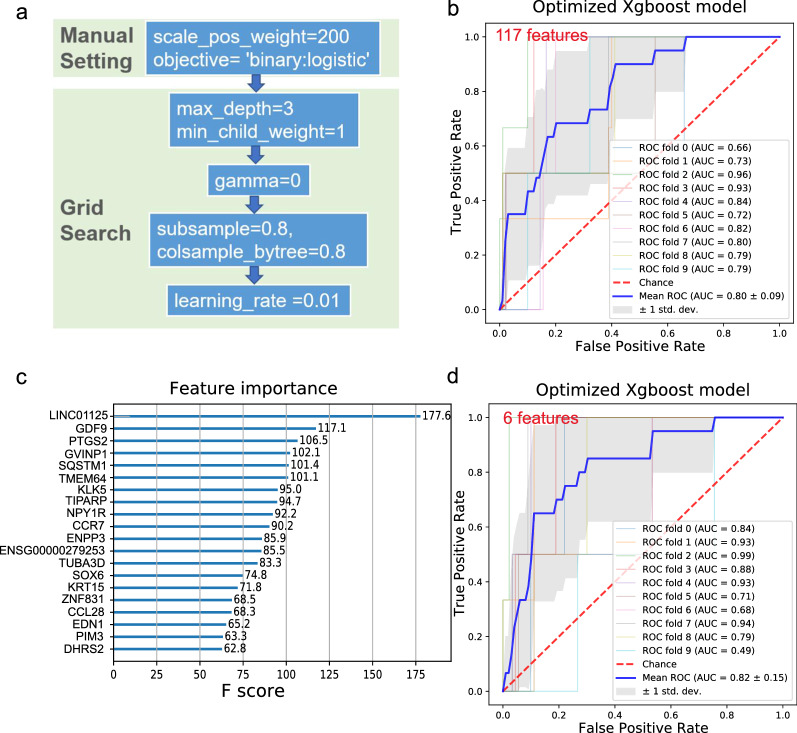
Fig. 3.
Feature selection and optimized XGBoost model for the prediction of metastatic status in breast cancer. a The order in which the parameters were tuned and the final parametric results are presented. b The ROC curve was plotted, and the mean AUC was calculated following XGBoost fed by 117 features generated by DEG analysis. c The importance of the features fed for XGBoost modeling was calculated and ranked in descending order. d The ROC curve was plotted, and the mean AUC was calculated following XGBoost fed by the selected 6 features

