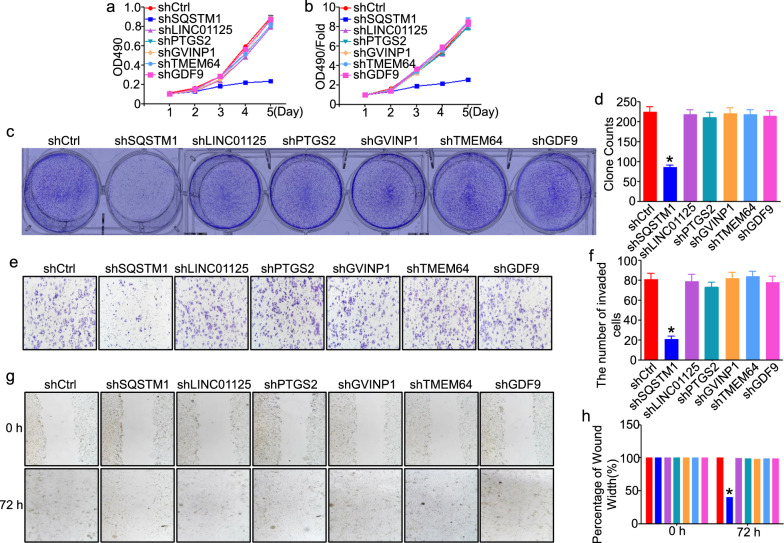
Fig. 5.
Cell proliferation, migration and invasion in vitro after silencing each of the selective gene signatures in breast cancer cells. a, b MTT assays in SQSTM1-, GDF9-, LINC01125-, PTGS2-, GVINP1-, and TMEM64-silenced MCF-7 cells. c, d Colony formation assays in SQSTM1-, GDF9-, LINC01125-, PTGS2-, GVINP1-, and TMEM64-silenced MCF-7 cells. e, f Transwell assays in SQSTM1, GDF9-, LINC01125-, PTGS2-, GVINP1-, and TMEM64-silenced MCF-7 cells. g, h Wound healing assays in SQSTM1-, GDF9-, LINC01125-, PTGS2-, GVINP1-, and TMEM64-silenced MCF-7 cells. All representative pictures are shown on the left, and statistical results are shown on the right. Bar graph data are presented as the mean ± SEM; * refers to P < 0.05

