Figure 2.
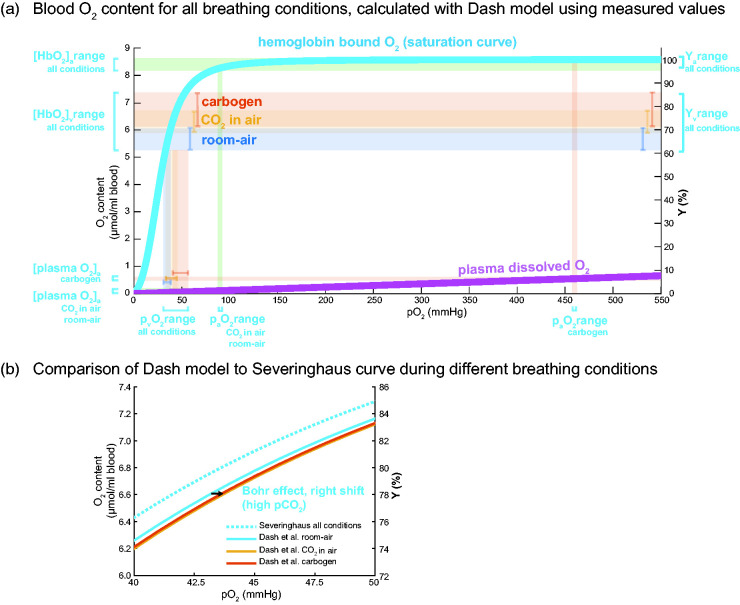
Oxygen saturation and content in blood for the different breathing conditions. The measured pEtCO2 values and assumed hematocrit values were used as input for the Dash et al. model to generate the subject-specific curves on saturation, hemoglobin bound and plasma dissolved O2 content over a range of pO2 between 0 and 550 mmHg. a) Group average hemoglobin bound O2 saturation curve (light blue) as computed using Dash et al. physiological model 42 and the plasma dissolved O2 curve (magenta) as a function of the partial pressure of O2 (pO2). On the right y-axis, the measured ranges of hemoglobin blood oxygenation Ya(%) and Yv(%) for the different breathing conditions (room-air in blue, ‘CO2 in air’ in orange, carbogen in red, and the corresponding O2 content in μmol/ml blood on the left y-axis ([HbO2]a and [HbO2]v ranges). The associated partial pressure ranges of O2 (pvO2 and paO2) found via the O2 saturation curve (light blue) are shown on the x-axis. Note the high paO2 for the carbogen condition and the associated plasma dissolved O2 content shown on the bottom left (red). b) A zoomed part of the O2 saturation curve (light blue in a)) showing the traditional O2 saturation curve by Severinghaus (dotted light-blue) compared to the revised model by Dash et al. with dependency on the subject’s pCO2 and Hct. The hypercapnic conditions induce a right shift caused by the Bohr effect, shown by the arrow (‘CO2 in air’ in orange, carbogen in red). The effect of this right shift, however, on the arteriovenous O2 difference is negligible for all breathing conditions. See Figure 3 for the O2 content and the arteriovenous difference values (boxplots) for all breathing conditions.

