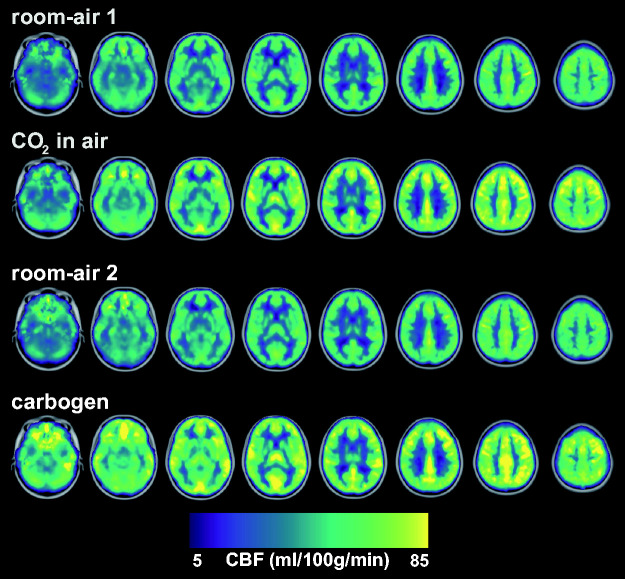
Figure 4.
Group average CBF maps for the different conditions where a notable and similar increase in CBF is observed for ‘CO2 in air’ and carbogen (see also Table 1). The individual maps were registered to MNI space before averaging and are overlaid on the 2 mm MNI brain template.

