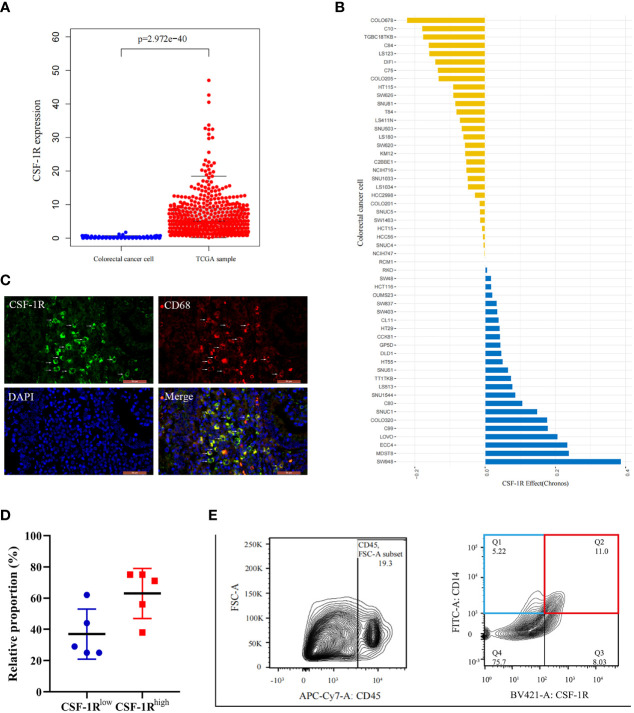
Figure 2.
Characterization of CSF-1R distribution in COAD tissues and tis perturbation effects in CRC cells. (A).The boxplot shows the difference of CSF-1R expression between the TCGA samples and established colorectal cancer lines. (B) CSF-1R perturbation effects in CRC cells (A score of 0 is equivalent to a gene that is not essential whereas a score of -1 corresponds to the median of all common essential genes). (C) Immunofluorescence staining of CD68 and CSF-1R in COAD specimen. (D) The proportions of CSF-1Rlow TAMs and CSF-1Rhigh TAMs in COAD specimen. (E) Representative flow cytometric plot of the sorted CSF-1Rlow TAMs and CSF-1Rhigh TAMs.

