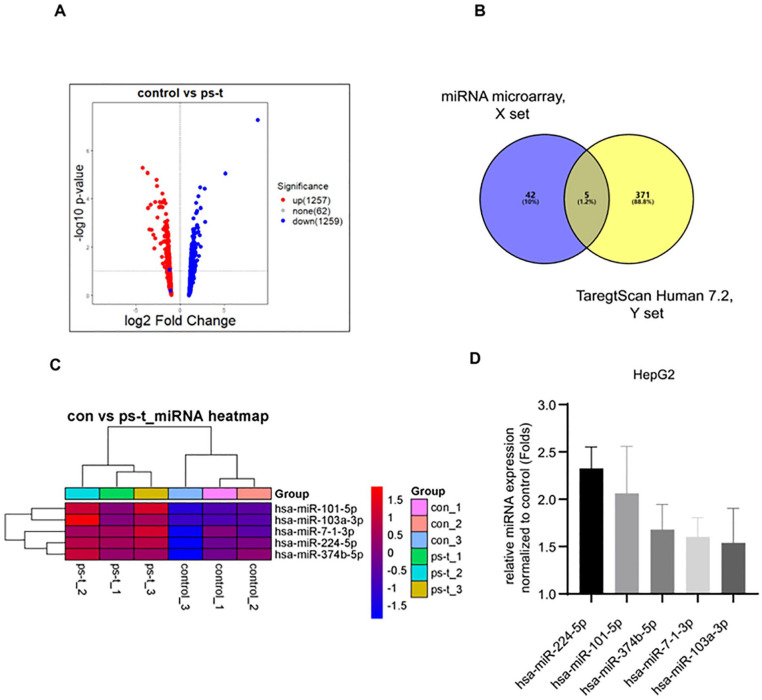
Figure 3.
(A–D) The screening procedure of miRNAs potentially targeting ABCB1 gene. (A) (Volcano map): Expressions of miRNAs regulated by PS-T via microarray (Affymetrix Gene Chip 4.0): 1257 were up-regulated miRNAs, 1259 were down-regulated miRNAs, and 62 were unchanged miRNAs. (B) (Venn diagram): The results of the intersection of the X and Y data set: 5 miRNAs possibly targeting ABCB1 gene were remained (https://bioinfogp.cnb.csic.es/tools/venny/index.html). (C) (Heat map) The differential expressions of 5 screened miRNAs: 5 were up-regulated and 0 was down-regulated. (D) (Bar plot): The differential expressions of 5 screened miRNAs (arranging from high level to low level). (A) and (C) were conducted by using R package version 4.0.

