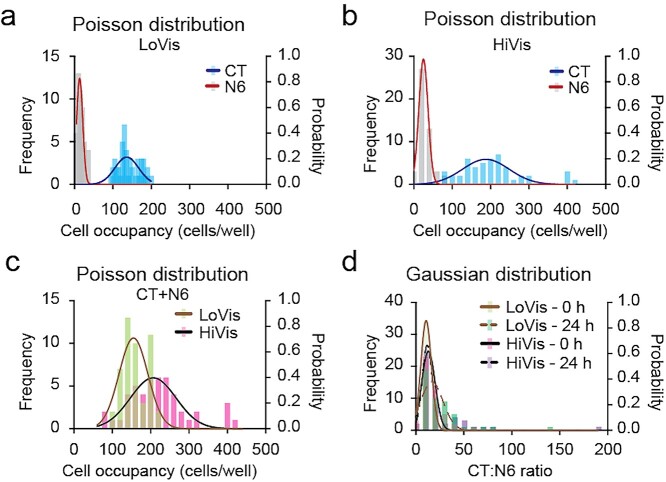
Figure 2.
Cell occupancy analysis of Batch 1 CAR-T cells. (a–c) Poisson distribution of Batch 1 CAR-T and Nalm6 cells on chip. Frequency distribution analysis of CAR-T (CT) and Nalm6 (N6) cells in low-viscosity medium (LoVis) and high-viscosity medium (HiVis) on chip at 0 h was performed. Distribution frequency and probability was plotted against cell occupancy in all wells on chip; each column represented one data grid automatically classified by GraphPad Prism; the lines indicated Poisson distribution curves generated by GraphPad Prism. (d) Gaussian distribution of CT:N6 ratio on chip. Frequency distribution analysis of CT:N6 ratio under both fluid conditions before and after treatment was performed. Distribution frequency and probability was plotted against CT:N6 ratio in all wells on chip; each column represented one data grid automatically classified by GraphPad Prism; the lines indicated Gaussian distribution curves generated by GraphPad Prism.

