Figure 3.

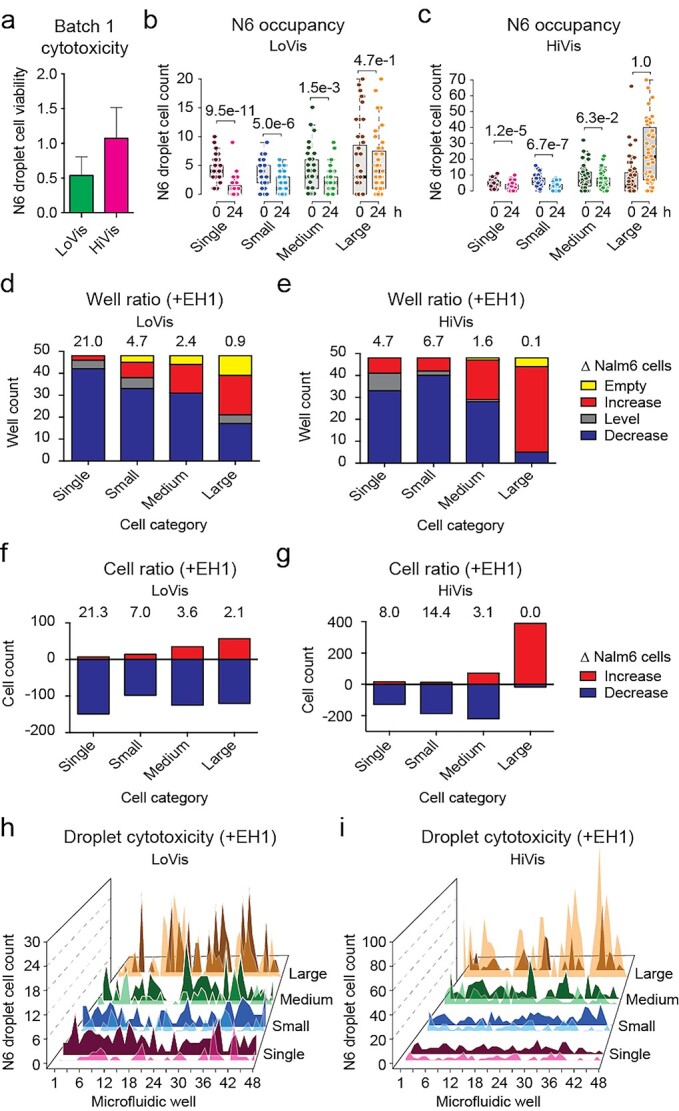
Cytotoxicity assessment of Batch 1 CAR-T cells. (a) Overall cytotoxicity of Batch 1 CAR-T cells under different fluid conditions. Mean Nalm6 droplet cell viability was plotted against LoVis and HiVis, respectively; the error bars denoted standard deviation of all replicate wells. (b and c) Analysis of Nalm6 occupancy before and after treatment on chip. Analysis of Nalm6 occupancy in different cell categories at 0 and 24 h post-treatment on chip was performed. Nalm6 droplet cell count was plotted against cell category and treatment time; each dot represented one well; the thick black line, grey box and dotted error bars of the box plot indicated median Nalm6 droplet cell count, interquartile range between −1σ and 1σ, and range of Nalm6 droplet cell count of all wells, respectively; the numbers indicated P-values of two-tailed t test. (d and e) Well ratio analysis of CAR-T cytotoxicity under different fluid conditions. Well ratio was plotted against cell categories; each column indicated the number of wells containing no, increasing, same or decreasing number of Nalm6 cells; the numbers indicated the well ratio of the specified dataset. (f and g) Cell ratio analysis of CAR-T cytotoxicity under different fluid conditions. Cell ratio was plotted against cell categories; each column indicated the number of Nalm6 cells that increased or decreased in sum; the numbers indicated the cell ratio of the specified dataset. (h and i) Hill plot of Nalm6 occupancy along all wells on chip. Nalm6 droplet cell count was plotted against consecutive wells on chip; each peak indicated the number of Nalm6 cells in the specified droplet; dark-colored shade indicated the cell number before treatment, whereas light-colored shade indicated the cell number after treatment.
