Figure 1.
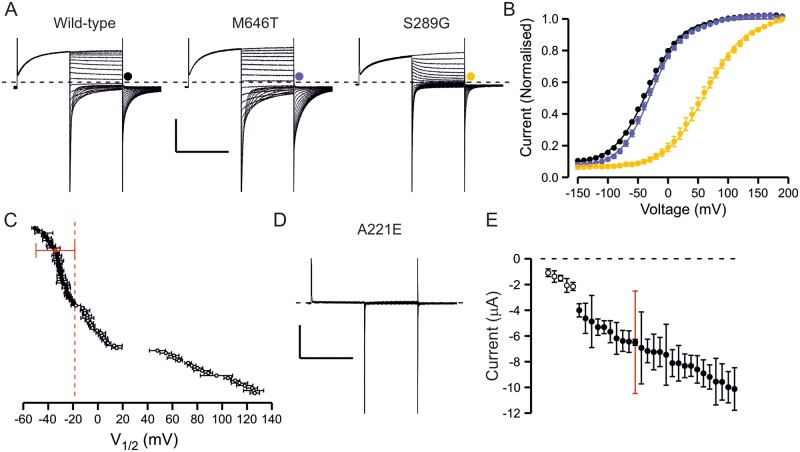
Overview of functional properties of ClC-1 variants. (A) Representative traces of wild-type channel, a variant with wild-type-like functional features (M646T) and a variant with shifted voltage dependence of activation (S289G). From holding voltage of −80 mV, 250 ms pre-pulse step to +60 mV, 250 ms test voltage steps from −150 mV to +190 mV in 10-mV increments (only traces in response to pulses up to +60 mV are shown) and a tail voltage step to −100 mV were applied. Scale bars: = 250 ms (x), 3 µA (y). (B) Voltage dependence of activation of wild-type (black), M646T (blue) and S289G (yellow) channels. Current at the beginning of tail voltage step was normalized to peak amplitude of the Boltzmann fit for each cell and the mean ± SEM normalized current data are shown. Solid lines show fit of the Boltzmann equation to mean data. (C) Mean V1/2 ± SEM is shown for each variant. If the V1/2 of the variant was depolarized relative to the cut-off voltage (wild-type ± 1.5× SD red dashed vertical line) the variant was considered pathogenic. If the V1/2 was to the left of the cut-off it was considered wild-type-like. (D) Representative current traces of a variant (A221E) with minimal ClC-1 currents. Scale bars as in A. (E) Mean ± SEM tail current amplitude of variants with wild-type-like voltage dependence. Red bars show SD of wild-type current amplitude data. While most variants showed wild-type-like current amplitude, for five variants many cells did not express currents and when the currents were detectable the mean amplitude was outside the limits of wild-type ± SD. These variants were considered pathogenic due to reduced expression. Numbers are shown in Supplementary Table 4.

