Figure 2.
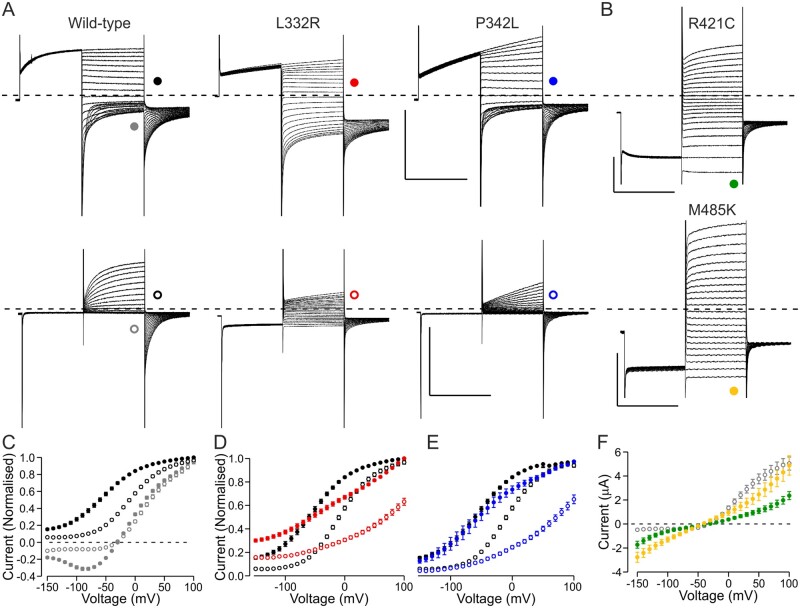
Functional properties of variants where the dysfunction could not be described by analysis of V1/2 or current amplitude only. (A) Representative current traces of wild-type, L332R and P342L channels. Voltage protocol was as in Fig. 1A except that the holding voltage was −40 mV (Vh = −40 mV) (top row) or as in Fig. 1A but the pre-pulse step was to −140 mV (VPP = −140 mV) (bottom row). Scale bars = 250 ms (x), 5 µA (y). (B) Representative current traces of R421C and M485K channels. Voltage protocol was as in Fig. 1A except that the pre-pulse step was to −140 mV. (A and B) Traces in response to test pulses up to +60 mV are shown. Scale bars = 250 ms (x), 1 µA (R421C) or 3 µA (M485K) (y). (C) Data for wild-type channels are shown in response to test voltages (grey) or to tail voltage (black) using the Vh = −40 mV protocol (solid symbols) and VPP = −140 mV protocol (open symbols). Data for each cell are normalized to current in response to (grey) or immediately after (black) a voltage step to +100 mV. Only a subset of wild-type cells was analysed (n = 18). (D and E) Data for L332R (red) and P342L (blue) are shown for Vh = −40 mV (solid) and VPP = −140 mV (open) protocols. Data are normalized as in C. L332R n = 13 and P342L n = 11. Wild-type data as in C are shown in black. (F) Mean current at the end of the test pulse is plotted against the test voltage for R421C (green) (n = 19) and M485K (n = 9) channels. Wild-type data for cells in C are shown in grey.

