Figure 5.
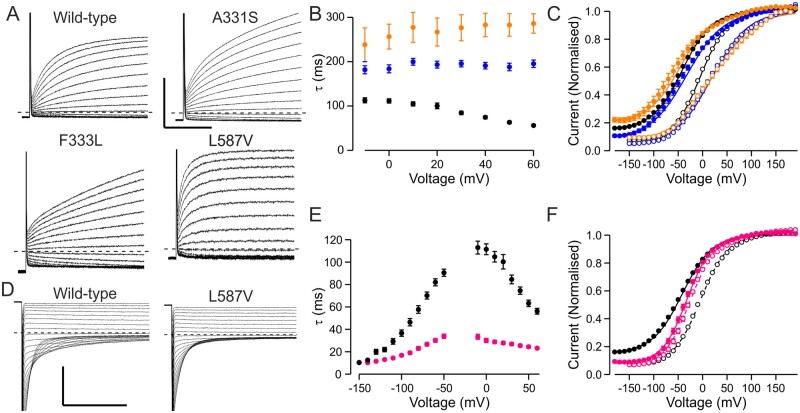
Alternative pathogenic mechanisms. (A) Representative current traces showing time course of activation of wild-type, A331S, F333L and L587V. Holding voltage was −80 mV, responses steps to voltages between −60 and +60 mV are shown. (A and D) Scale bars = 50 ms (x), 5 µA (y). (B and C) Time constant (B) and voltage dependence (C) of activation for wild-type (black), A331S (blue) and F333L (orange) channel. Solid symbols show data for Vh = −40 mV protocol, open symbols for VPP = −140 mV protocol. (D) Representative current traces showing time course of deactivation of wild-type and L587V channels. Holding voltage was −80 mV, traces show the time course of closure following pre-pulse to +60 mV for voltage range +50 to −150 mV. (E and F). Time constants of activation and deactivation (E) and voltage dependence of activation (F) for wild-type (black) and L587V (pink) channels. Solid symbols show data for the Vh = −40 mV protocol, open symbols for the VPP = −140 mV protocol.

