Figure 6.
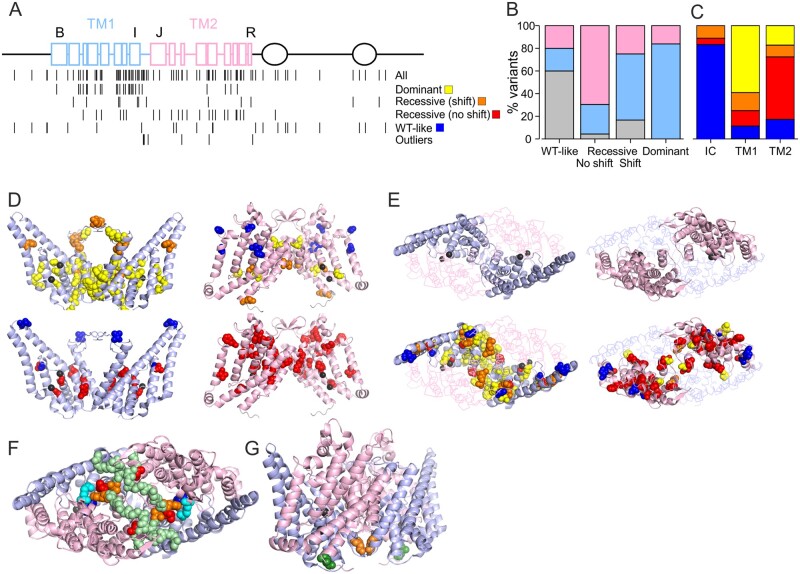
Mapping of substituted residues (variants) to ClC-1 structure. (A) Two-dimensional map of variants. Top: ClC-1 intramembrane helices are represented as squares, CBS domains as ovals and the connecting loops as lines. Blue indicates TM1, pink TM2, black intracellular (IC). Helices B, I, J and R are indicated. Bottom: Location of all the variants in this cohort is shown on the top row and location of the variants with distinct functional features is specified below. Two rows of recessive variants are shown depending on if the variant in homomeric condition shifted voltage dependence [Recessive (shift)] or just reduced functional expression [Recessive (no shift)]. Outliers include the variants shown in Figs 2 and 5. (B) Percentage of variants located in intracellular domains (grey), TM1 (blue) or TM2 (pink) is plotted for variants with distinct functional features. (C) Percentage of variants with dominant (yellow), recessive (shift) (orange) or recessive (no shift) (red) and wild-type-like functional features (blue) are plotted for variants located in the intracellular domains (IC), TM1 or TM2. (D) Mapping variants to TM1s (left, light blue) and TM2 (right, light pink) to ClC-1 structure (6COY).22 TMs of both subunits are shown, variants are plotted on both subunits, Cl− are shown in black. View is on membrane plane. Cl− ions (black) on left and right graphs are aligned to illustrate location of TM2 higher up in membrane plane compared to TM1. Top row shows dominant variants in yellow and Recessive (shift) in orange. Bottom row shows Recessive (no shift) variants in red. Variants with wild-type-like functional features are shown in blue. (E) Top row shows a view from above membrane plane with the two TM1s (left, light blue) or TM2s (right, light pink) shown in a cartoon while the other TM is shown in ribbon. On the bottom row all variants are mapped based on their functional group as in B. Most of subunit interface is formed by the two TM1s (top) and most variants that shift voltage dependence of activation at any condition are located here. (F) Variants with attenuated activation particularly following hyperpolarized pre-pulse (L332 and P342 in red, A331 and F333 in orange) are shown viewed from above the membrane plane. These variants are located on IJ-linker (main chain is shown in light green spheres) that forms an interface with the IJ-linker of the neighbouring subunit and reaches the proximity of variants that showed enhanced currents at hyperpolarized voltage [R421C (magenta) and M485K (cyan)]. (G) Location of L587V (green) variant that accelerated both opening and closing of the channel at the intracellular opening of the selectivity filter pathway. The F297S (orange) variant that displayed a larger shift in voltage dependence of activation when co-expressed with wild-type subunits compared to homomeric F297S channels is also shown. Note that the variants mentioned in F or the L587V variant are not shown in B or C.

