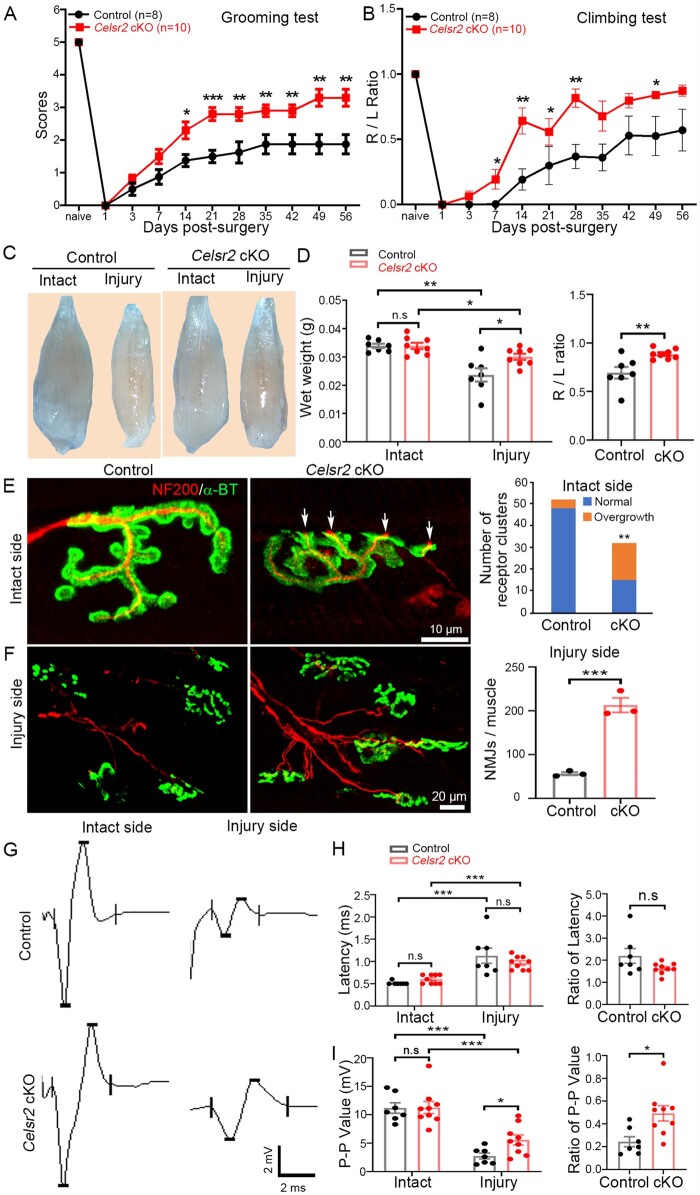
Figure 4.
Celsr2 cKO in spinal motor neurons improves functional recovery and NMJ formation after root avulsion/reimplantation. (A and B) After root avulsion/reimplantation, the function of the affected forelimb was assessed using the grooming (A) and climbing test (B). Scores were significantly higher in Celsr2 cKO (Isl1-Cre; Celsr2f/–) compared to littermate controls (Celsr2f/–) at Days 14, 21, 28, 35, 42, 49 and 56 post-injury. During the climbing test, usage of injured (R) and intact (L) forelimbs was compared; the R/L ratio was increased in the Celsr2 cKO. *P < 0.05; **P < 0.01; Student’s t-test. (C and D) Biceps collected 56 days after injury were more atrophic on the injured than the intact side, in both mutant and control mice (C). Muscle wet weight on the intact side was comparable in both groups, whereas it was higher on the injured side in mutants versus controls, as reflected by the increased the R/L ratio (injured side to intact side) (D). Wet weight, control: 0.0339 ± 0.0008 g, mutant: 0.0339 ± 0.0011 g on the intact side, P < 0.05; control: 0.0237 ± 0.0024 g, mutant: 0.0300 ± 0.0010 g on the injured side, P < 0.05; the R/L ratio: 0.69 ± 0.06 and 0.89 ± 0.02 in the control and the mutant, respectively, P < 0.01. *P < 0.05; **P < 0.01; Student’s t-test; n = 7 in the control and n = 8 in the mutant. (E and F) NMJs were examined using anti-NF200 and anti-ɑ-BT double staining 56 days post-surgery. On intact sides (E), several cholinergic receptor clusters showed axonal terminals overgrowth in Celsr2 cKO (17/32; indicated by arrows), but rarely in the control (4/52). On injury sides (F), there were more numerous growing axons and NMJs in the mutant than in the control (control: 56.33 ± 3.53, mutant: 213.00 ± 16.56 NMJs/muscle, P < 0.001, n = 3 animals in each group). **P < 0.01; ***P < 0.001; Student’s t-test for NMJ number comparison and chi-square for receptor cluster comparison. (G–I) EMG of biceps was recorded 56 days post-surgery (G). The latencies were increased after injury, with no difference between both groups (H; control: 0.514 ± 0.014, mutant: 0.600 ± 0.033 ms on the intact side; 1.129 ± 0.170 ms for control and 1.632 ± 0.083 ms for mutant on the injured side; ratio of latency: 2.195 ± 0.335 and 1.632 ± 0.083 in the control and the mutant, respectively; P > 0.05 in all comparisons). Denervation resulted in a significant decrease of the peak–peak amplitude in both groups, but the amplitudes and the ratio of the injured to the intact muscle was significantly higher in the mutant compared to the control (I; control: 11.182 ± 0.923 mV, mutant: 11.269 ± 1.055 mV on the intact side, P > 0.05; control: 2.740 ± 0.523 mV, mutant: 5.572 ± 0.873 mV on the injured side, P < 0.05; ratio: 0.244 ± 0.044 and 0.492 ± 0.067 in the control and the mutant, respectively, P < 0.05). *P < 0.05; **P < 0.01; ***P < 0.001; n.s, not significant; Student’s t-test; n = 7 in the control and n = 9 in the mutant.

