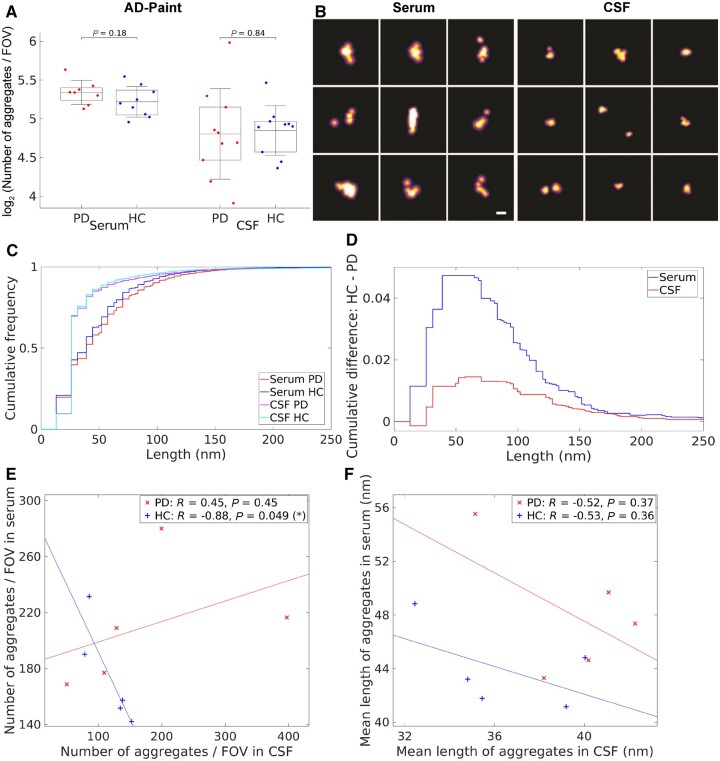
Figure 4.
Characterization of the protein aggregates detected in Parkinson’s disease (n = 8) compared to healthy control serum (n = 9) and Parkinson’s disease (n = 10) compared to healthy control CSF (n = 10) using AD-PAINT. (A) Quantification of the number of the aggregates detected by AD-PAINT. For five Parkinson’s disease (PD) and five healthy controls (HC), serum and CSF samples were paired. Parkinson’s disease versus control comparisons using the permutation (exact) test were insignificant (P > 0.05). Serum aggregates were undiluted and CSF was diluted 2-fold. (B) Examples of super-resolution images taken using AD-PAINT for Parkinson’s disease CSF and serum samples. Scale bar = 100 nm. (C) Cumulative length distributions for Parkinson’s disease and healthy control serum and CSF samples measured by AD-PAINT. (D) Difference between Parkinson’s disease and control cumulative length distributions for CSF and serum retrieved from C. (E) Correlation between the number of aggregates in serum versus CSF for matched Parkinson’s disease (red) and healthy controls (blue) subjects. (F) Correlation between mean length of aggregates in serum versus CSF for matched Parkinson’s disease (red) and control (blue) samples. Pearson’s correlation coefficients (R) and P-values are indicated. FOV = field of view.

