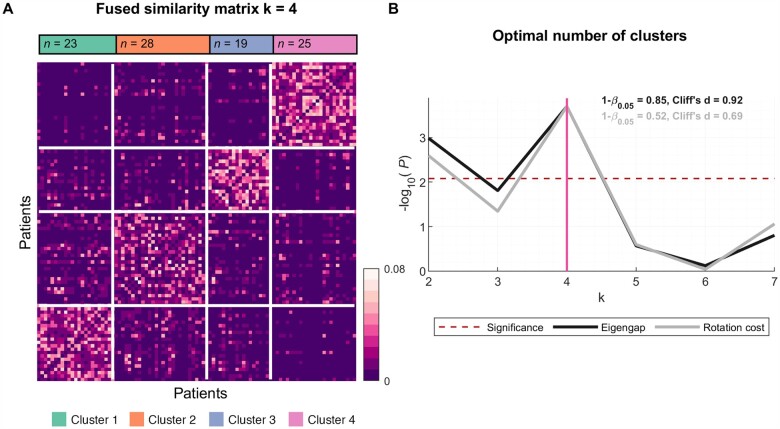
Figure 1.
EEG measures identify four ALS clusters: Fused similarity matrix and the optimal number of ALS clusters. (A) Fused similarity matrix of ALS patients is sorted based on the clusters, which were identified using spectral clustering. (B) At k = 4, both measures reflecting the optimal number of clusters (eigengap, black; rotation cost, grey) reach the highest significance (P < 0.008, Bonferroni corrected; red dashed line) with statistical power (1 − β0.05) 0.85 and 0.52, and effect size (Cliff’s d) 0.92 and 0.69, respectively. The number of patients in clusters 1–4 are n = 23, 28, 19 and 25, respectively.

