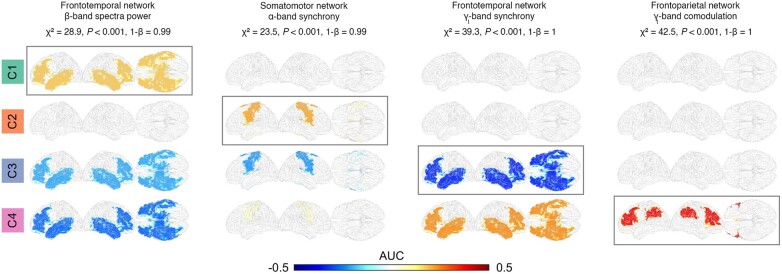
Figure 2.
Distinct neurophysiological profiles of ALS clusters. For each cluster, a unique neurophysiological change (brain network, frequency band and EEG measure) was identified using AUC statistics estimated between the ALS clusters and control data (Supplementary material). The networks vary significantly across clusters in all four cases (Kruskal–Wallis one-way ANOVA, P < 0.001, FDR). The potential effects of age and gender on the identified changes were rejected based on the linear model analysis (Supplementary material). AUC = area under the receiver operating characteristic curve centred around zero; positive values indicate an increase, whereas negative values indicate a decrease compared to healthy controls.

