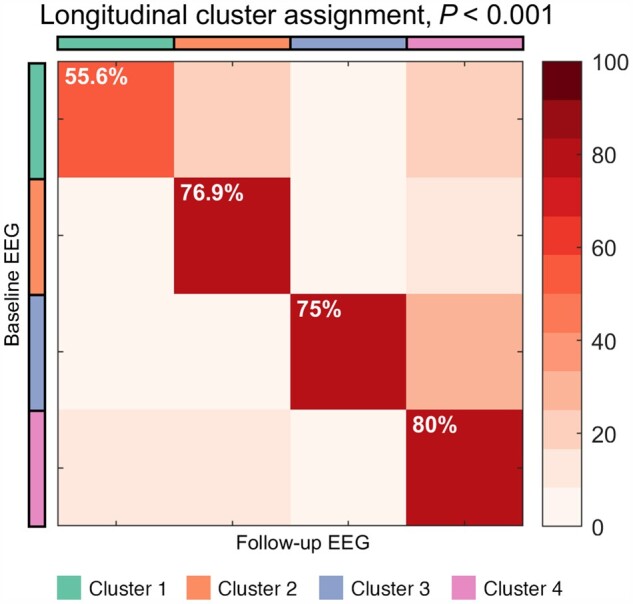
Figure 4.

Clusters show high stability at reassessment. The overall stability is 72% and statistically significant (P < 0.001, Fisher’s exact test). Total number of patients with a follow-up (mean ± standard deviation: 5.1 ± 1.8 months after the initial recording session) is n = 36, wherein 9, 13, 4 and 10 patients belong to clusters 1–4, respectively.
