Figure 3.
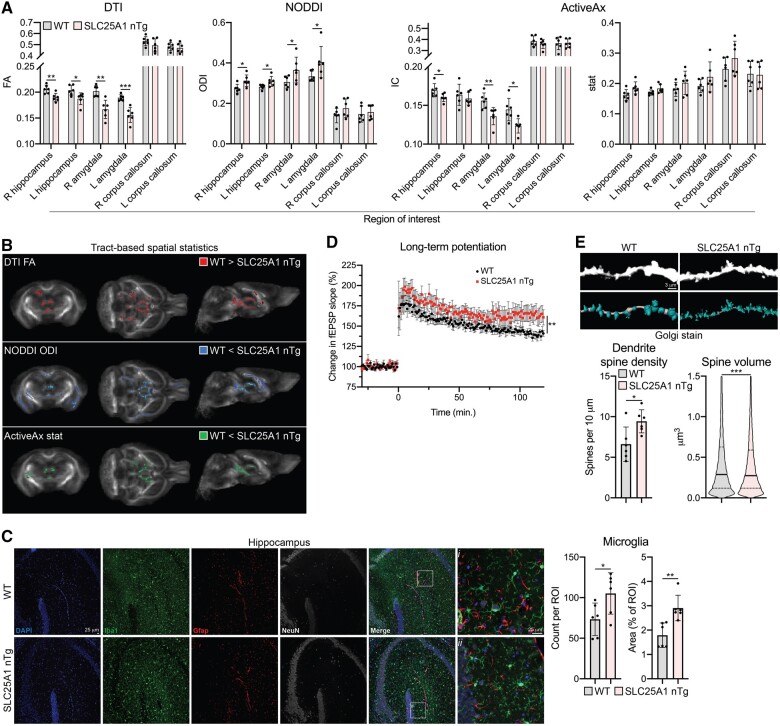
SLC25A1 nTg mice have altered white matter integrity and synaptic plasticity. (A) Ex vivo DWI of male wild-type and SLC25A1 nTg mice at 4 months old, n = 6 mice per genotype. Fractional anisotropy (FA), orientation dispersion index (ODI), and intraneuronal compartment (IC)/glial stat compartment parameters were calculated from a region of interest analysis using DTI, NODDI and ActiveAx models, respectively. Data are mean ± SD. *P < 0.05, **P < 0.005, ***P < 0.0005 via Student’s t-test with Benjamini–Hochberg procedure with FDR = 0.05. (B) Whole-brain voxel-wise TBSS analysis of DWI in panel A. Coloured voxels are statistically different between wild-type and SLC25A1 nTg (P < 0.05). (C) Paraffin-embedded brain slices immunostained for Iba1 (microglia), Gfap (astrocytes) and NeuN (neuronal marker). Quantification of Iba1-positive cells is shown as mean ± SD, n = 6 mice per genotype (three males, three females) at 9–12 months of age. (D) Theta-burst (3×) LTP in hippocampal brain slices. Data are mean ± SEM. **P < 0.005 via Student’s t-test of the average potentiation value in the last 10 min, n = 8 slices per genotype (from two male and three female wild-type mice and three male and three female SLC25A1 nTg mice). Mice are 6–8 months old. (E) Golgi staining of CA1 pyramidal neuron apical dendrites (secondary branches). Representative images along with unbiased dendrite and spine reconstructions are shown. Dendrite spine density: data are shown as mean ± SD with each data-point representing one animal. Spine volume: data are a violin plot of each reconstructed spine’s volume with the solid line representing the median and dashed lines representing the 25th and 75th quartiles. *P < 0.05, ***P < 0.0005 via Student’s t-test, n = 6 mice per genotype (three males, three females) at 3 months of age.

