
Figure 5.
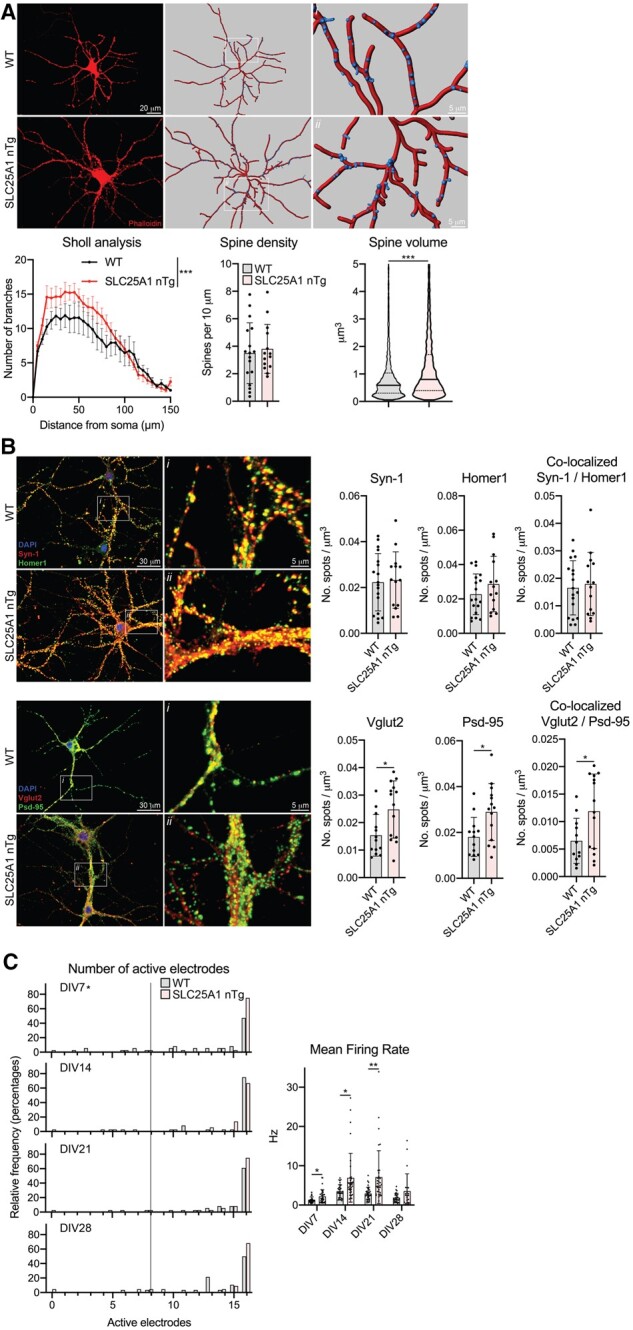
Primary hippocampal neurons from SLC25A1 nTg mice have increased dendritic branching, altered spine morphology and increased spontaneous activity. (A) Morphological assessment of cultured neurons at 15 DIV. Phalloidin staining (left) and unbiased computer-driven reconstruction (right) are shown along with quantification from n = 3 embryos per genotype. Sholl analysis: data are mean ± SEM. ***P < 0.0005 via two-way ANOVA. Spine density: data are mean ± SD with each data-point representing one neuron. Spine volume: data are displayed as a violin plot of each reconstructed spine’s volume with the solid line representing the median and dashed lines representing the 25th and 75th quartiles. ***P < 0.0005 via Student’s t-test (spine volume). (B) Immunostaining of cultured neurons for pre-/postsynaptic marker pairs Syn-1/Homer1 and Vglut2/Psd-95 at 15 DIV. Puncta were fit with 2 µm spots and normalized to neuron volume and spots co-localized if they were within 1 µm of each other. Data are mean ± SD with each data-point representing one neuron, n = 3 wild-type (WT) and n = 4 SLC25A1 nTg embryos. *P < 0.05 via Student’s t-test. (C) MEA spontaneous activity. Left: Histogram showing the number of active electrodes per network expressed as the relative frequency in percent. The vertical line demarks eight active electrodes, which is the minimum value required to be considered a mature network. *P < 0.05 via Mann–Whitney test comparing frequency distributions. Right: Spontaneous activity measured by mean firing rate. Each data-point is an independent network of cultured neurons and exhibits at least 8 of 16 active electrodes. *P < 0.05, **P < 0.005 via mixed effects analysis with Sidak’s multiple comparison test. Data are from six embryos per genotype.