Figure 7.
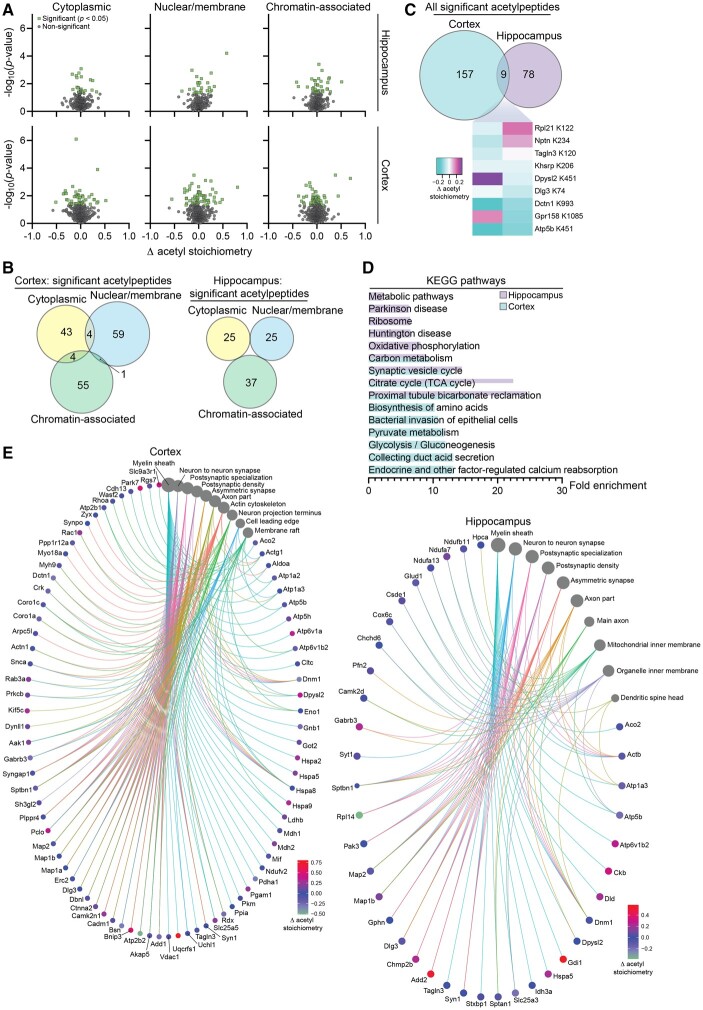
SLC25A1 nTg mice display changes in the stoichiometry of acetylation in the hippocampus and cortex. (A) Volcano plots displaying all quantified acetylpeptides in the SLC25A1 nTg versus wild-type hippocampus (top) and cortex (bottom) across the three subcellular fractions (cytosolic, nuclear/membrane and chromatin-associated). Change in acetylation stoichiometry (Δ acetyl stoichiometry) is calculated using the SLC25A1 nTg stoichiometry value minus the wild-type stoichiometry value. Statistically significant acetylpeptides (P < 0.05) are shown in green with all other acetylpeptides in grey, n = 4 male mice per genotype at 2 months of age. (B) Overlap of the statistically significant acetylpeptides across the three subcellular fractions in both the hippocampus and cortex. (C) Overlap between the hippocampus and cortex of all the statistically significant acetylpeptides (combined from the three subcellular fractions). A heat map of the nine overlapping acetylpeptides between the two tissue types is shown. The change in acetylation stoichiometry for the following acetylpeptides is displayed (detected in multiple cortex subcellular fractions): Atp5b K451, nuclear/membrane; Dctn1 K993, cytoplasmic. (D) The fold enrichment of KEGG pathways determined from proteins harbouring the acetylation sites that were significantly changed from wild-type in the hippocampus and cortex. The top 10 categories sorted by enrichment score are shown with a filtered FDR score of 0.05. (E) Gene-network plots of proteins harbouring the acetylation sites that were significantly changed from wild-type in the hippocampus and cortex. Plots constructed via an overrepresentation analysis using the GO cellular component function database. The dot size of each network category is scaled by the number of overlapping proteins within the category. The top 10 categories sorted by enrichment score are shown with a filtered FDR score of 0.05. Because proteins could be found in multiple fractions and potentially acetylated on multiple lysine sites, the Δ acetyl stoichiometry value displayed in the network plot is as follows: (i) if the acetylpeptide was detected in multiple subcellular fractions, the fraction selected for illustration was prioritized as follows: cytoplasmic, nuclear/membrane, then chromatin-associated; and (ii) if multiple sites per protein exhibited significantly changed acetyl stoichiometry, the lowest number lysine residue was selected for illustration.

