Figure 3.
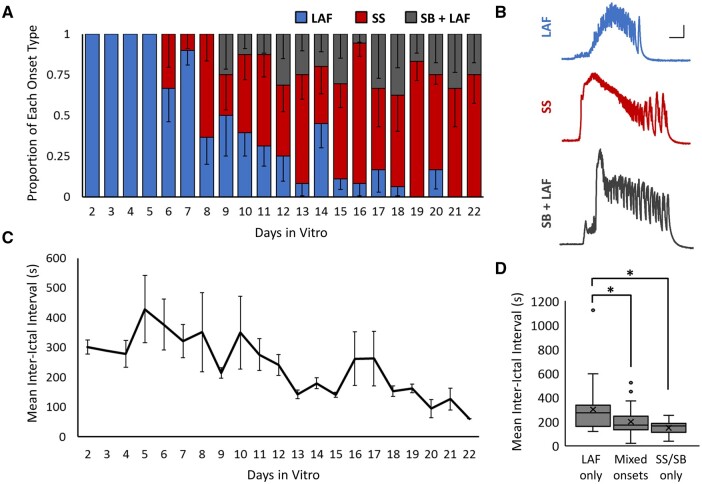
Evolution of ictal onset type. (A) Proportion of each seizure onset type by days in vitro [n = 150 seizures, from 12 slice cultures (from four animals)]. Blue = low amplitude fast activity onset (LAF), red = sentinel spike onset (SS) and grey = spike burst + low amplitude fast onset (SB+LAF). (B) Representative ΔF/F calcium traces of each ictal onset type, all from the same slice culture. Scale bar = 5 s and 0.1 ΔF/F. (C) Mean inter-ictal interval by days in vitro, n = 12 slice cultures. (D) Mean inter-ictal interval during days when only LAF onset seizures were present, days with mixed seizure onsets, or days with only SS and/or SB+LAF onset. Box = inner-quartile range (IQR); line = median; X = mean; dots = outliers, >1.5 of the IQR. n = 32, 40 and 14 days, from nine slices and four animals; *P < 0.05 Student's t-test, with Holm–Bonferroni correction for multiple comparisons.

