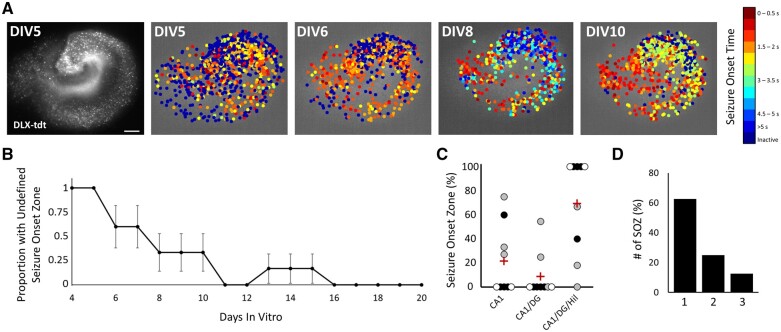
Figure 4.
Evolution of seizure onset zone. (A) Left image shows the overall anatomy of an example slice with DLX-cre driven tdTomato labelling of interneurons. Scale bar = 100 µm. Other panels show the onset time of individual neurons within the example slice over four different seizures spanning DIV5 to DIV10. (B) Plot of the proportion of seizures with an undefined seizure onset zone over time. n = 6 slice cultures (all slices with early seizures captured by high-resolution imaging). (C) Bee-swarm plot of percentage of seizures from each slice with each seizure onset zone: CA1, CA1 and dentate gyrus (DG), or CA1, DG and hilus (Hil). Red cross = mean; n = 9 slices; colour of dot indicates slices from the same animal. (D) Percentage of slices with one, two or three observed seizure onset zones (SOZ); n = 9 slices.

