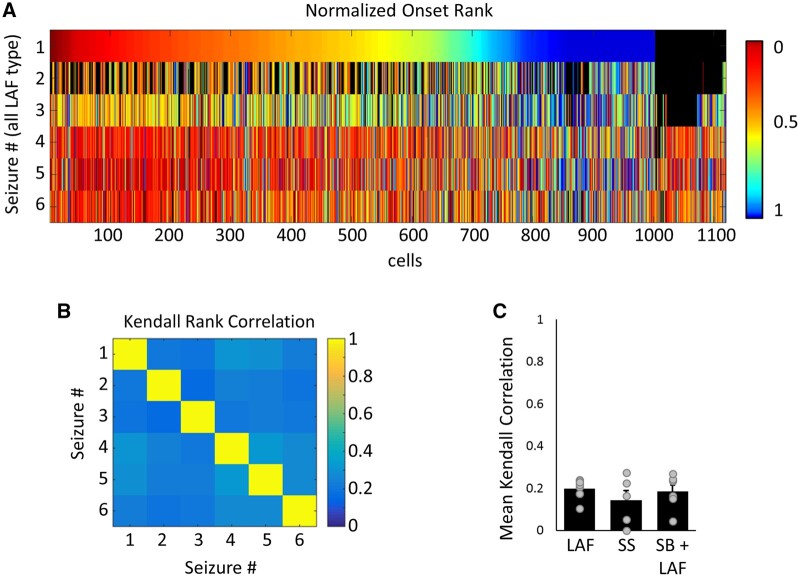
Figure 5.
Variable ictal onset sequences seizure to seizure. (A) Raster plot of normalized seizure onset rank of individual neurons for six LAF onset seizures. Cells were ordered by onset rank in seizure #1, and subsequent rows indicate the onset time of the same neurons (in the same order) for the following five LAF seizures captured. Colour bar = normalized onset rank; black = neurons not tracked in a given seizure. (B) Kendall rank coefficient for seizures in A. (Kendall rank coefficient can span −1 to 1, where 1 = perfect positive correlation and 0 = no correlation). (C) Mean Kendall rank coefficient by seizure onset type. n = 8, 7 and 5 slices for LAF, SS and SB+LAF onset, respectively. Average correlation was calculated for each slice from 2–13 seizures of the same onset type.

